










BLS E-Services FY26 income doubled while margins declined
Key highlights
- BLS E-Services total income increased from Rs 98.4 crore in FY22 to Rs 1,142.8 crore in FY26.
- BLS E-Services EBITDA margin declined to 8.7% in FY26 from 15.8% in FY25.
- BLS E-Services PAT was Rs 69.3 crore in FY26, while PAT margin fell to 6.1% from 10.8%.
- BLS E-Services cost of services rose to Rs 980.8 crore in FY26 from Rs 401.3 crore in FY25.
powered by IRIS
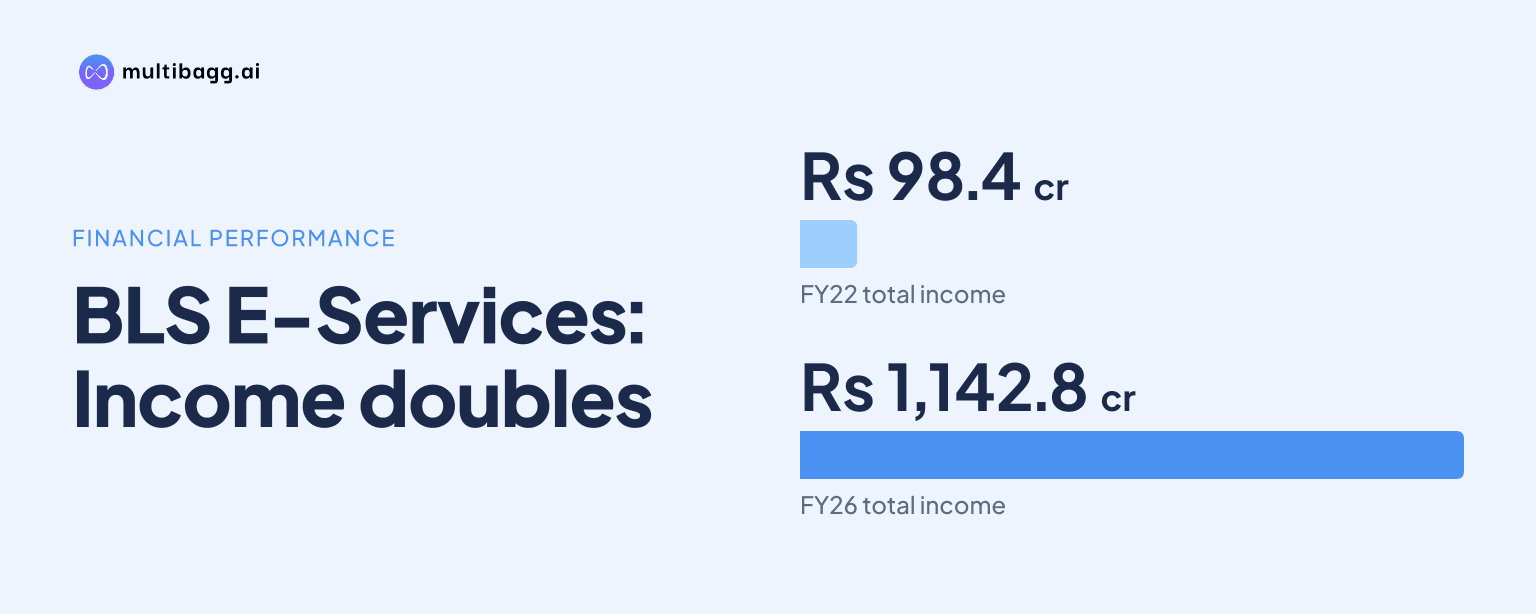
BLS E-Services Limited doubled total income to Rs 1,142.8 crore in FY26 from Rs 545.0 crore in FY25, while EBITDA margin declined to 8.7% from 15.8% as cost of services rose to Rs 980.8 crore. PAT increased to Rs 69.3 crore, but its margin fell to 6.1% from 10.8%.
Know BLS E-Services inside out
Results, valuation, peers and who's buying, in one view.
How fast did BLS E-Services grow from FY22 to FY26?
BLS E-Services increased total income from Rs 98.4 crore in FY22 to Rs 1,142.8 crore in FY26, a period for which management reports an 85% compound annual growth rate. Revenue from operations rose from Rs 96.7 crore to Rs 1,117.8 crore over the same period, while other income increased from Rs 1.7 crore to Rs 25.0 crore.
FY26 accounted for the largest annual increase in the reported series. Total income rose by Rs 597.8 crore from Rs 545.0 crore in FY25, while revenue from operations increased by Rs 598.4 crore from Rs 519.4 crore. The annual income sequence rose from Rs 246.3 crore in FY23 and Rs 309.6 crore in FY24 to Rs 545.0 crore in FY25 and Rs 1,142.8 crore in FY26.
What happened to BLS E-Services profitability in FY26?
BLS E-Services remained profitable in FY26, but profitability margins declined from FY25. EBITDA, or earnings before interest, tax, depreciation and amortisation, increased by Rs 13.8 crore to Rs 99.9 crore, but EBITDA margin fell by 7.1 percentage points to 8.7% from 15.8%. The presentation states that EBITDA includes other income.
PAT, or profit after tax, rose by Rs 10.5 crore to Rs 69.3 crore in FY26 from Rs 58.8 crore in FY25. However, PAT margin decreased by 4.7 percentage points to 6.1% from 10.8%. The difference in growth rates matters: total income more than doubled in FY26, whereas EBITDA and PAT increased by Rs 13.8 crore and Rs 10.5 crore, respectively.
The FY26 outcome reversed part of the margin expansion recorded through FY24. EBITDA margin rose from 8.7% in FY22 to 14.7% in FY23 and 16.1% in FY24, before slipping to 15.8% in FY25 and 8.7% in FY26. PAT margin followed a similar path, rising from 5.5% in FY22 to 10.8% in FY24 and FY25 before declining to 6.1%.
Which costs drove the FY26 margin change at BLS E-Services?
BLS E-Services’ cost of services rose by Rs 579.5 crore to Rs 980.8 crore in FY26 from Rs 401.3 crore in FY25. That increase was close to the Rs 597.8 crore rise in total income, making cost of services the largest change among the consolidated profit and loss lines disclosed for FY26. The presentation does not identify a specific reason for the increase.
Employee benefit expenses increased by Rs 5.6 crore to Rs 42.7 crore in FY26, while other expenses decreased by Rs 1.1 crore to Rs 19.4 crore. Finance costs fell to Rs 0.7 crore from Rs 0.8 crore, and depreciation was Rs 6.3 crore compared with Rs 6.2 crore. These movements were materially smaller than the change in cost of services.
Operating EBITDA, which excludes other income, rose to Rs 74.9 crore in FY26 from Rs 60.5 crore in FY25, but operating EBITDA margin declined to 6.7% from 11.6%. Profit before tax before exceptional items increased to Rs 92.9 crore from Rs 79.1 crore, while its margin reduced to 8.1% from 14.5%.
Got a follow-up? Ask IRIS
How did BLS E-Services’ balance sheet change by March 2026?
BLS E-Services reported total assets of Rs 761.9 crore at March 2026, compared with Rs 703.6 crore at March 2025 and Rs 55.9 crore at March 2022. Total equity and liabilities also stood at Rs 761.9 crore at March 2026. The presentation marks selected March 2025 comparative figures as restated under Indian Accounting Standard 103, Business Combinations.
Total equity increased to Rs 569.8 crore at March 2026 from Rs 518.4 crore a year earlier. The March 2026 total included Rs 431.6 crore of other equity and Rs 47.3 crore of non-controlling interest. Separately, BLS E-Services reported net worth of Rs 522.5 crore in FY26, compared with Rs 482.7 crore in FY25.
Working-capital lines expanded alongside income in FY26. Trade receivables rose to Rs 119.2 crore at March 2026 from Rs 93.4 crore at March 2025, and other current assets increased to Rs 414.3 crore from Rs 212.0 crore. Trade payables rose to Rs 82.1 crore from Rs 56.0 crore, while other financial liabilities fell to Rs 88.7 crore from Rs 110.6 crore.
What growth plans has BLS E-Services disclosed?
BLS E-Services says it plans volume-led organic growth across business correspondent services, loan disbursement, e-governance and assisted e-services. Management’s stated actions include pursuing new government tenders for e-governance, creating ties with banks, insurance companies and non-banking financial companies, and engaging vendors to broaden business-to-business-to-consumer services.
The company also plans to invest in technology, infrastructure and manpower to develop capabilities and consolidate existing platforms. Its network comprised more than 1,88,200 touchpoints and more than 60,000 customer service points across India. The model uses merchant-owned or merchant-leased touchpoints and e-stores, while BLS E-Services provides technology and other infrastructure where applicable.
BLS E-Services says it is actively scouting strategic inorganic opportunities that could provide synergies with existing businesses. Its disclosed operating subsidiaries include Starfin India at 100.0%, Zero Mass at 90.9%, BLS Kendras at 100.0%, Aadifidelis Solutions at 57.0% and Atyati Technologies at 100.0%. The presentation says the 57.0% Aadifidelis stake was acquired in 2024.
Conclusion
BLS E-Services’ FY22-to-FY26 financial record combines a Rs 1,044.4 crore increase in total income with lower earnings conversion in FY26. Income rose to Rs 1,142.8 crore and PAT to Rs 69.3 crore, but the increase in cost of services to Rs 980.8 crore coincided with EBITDA margin falling to 8.7% and PAT margin to 6.1%.
The next reported periods will show how management’s volume-led plans in business correspondent services, loan disbursement, e-governance and assisted e-services affect costs and margins. Areas to watch under the disclosed plan include government-tender wins, financial-institution tie-ups, technology investment and any strategic acquisitions after FY26 operating EBITDA margin reached 6.7%.