










BLS International revenue grew 37% CAGR and PAT 60% by FY26
Key highlights
- BLS reported FY26 consolidated revenue from operations of Rs 2,998.2 crore, versus Rs 849.9 crore in FY22.
- BLS reported FY26 PAT of Rs 723.8 crore and a FY22-FY26 PAT CAGR of 60%.
- BLS FY26 net worth reached Rs 2,463 crore and net cash balance reached Rs 1,434 crore.
- BLS Visa and Consular Services processed 44.1 lakh applications in FY26 and reported a 40.1% EBITDA margin.
powered by IRIS
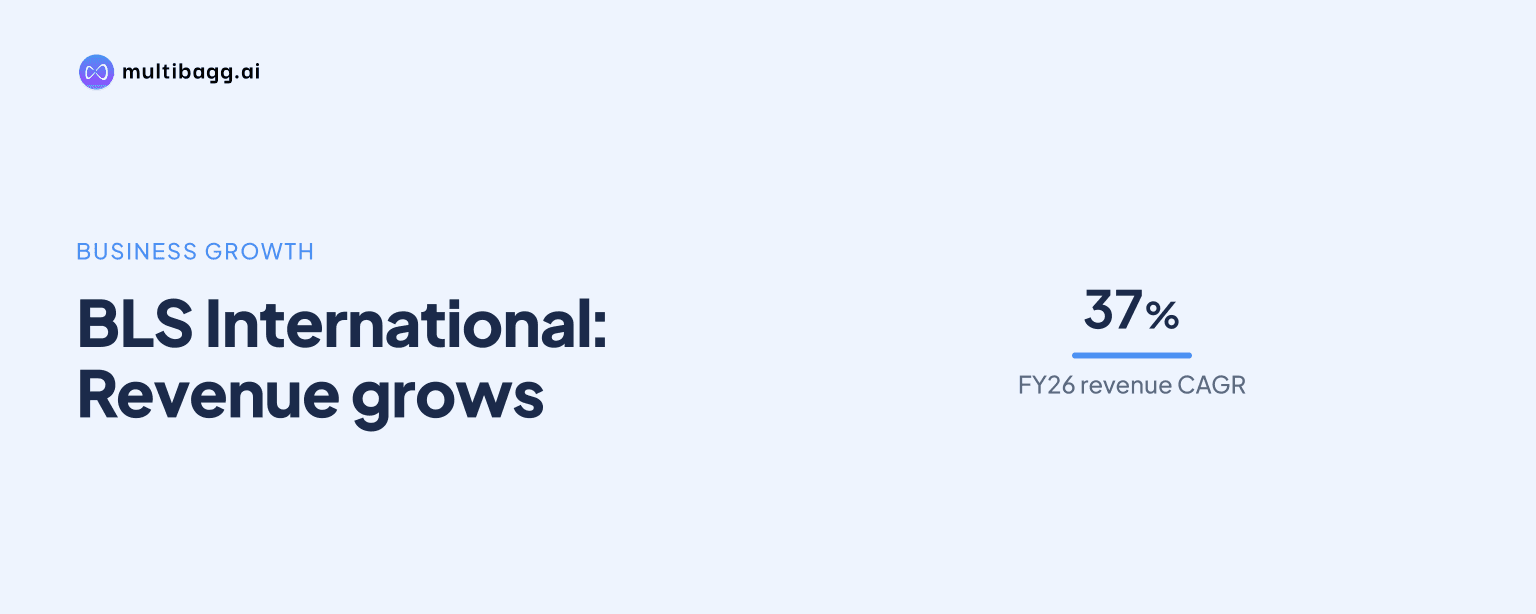
BLS International recorded a 37% compound annual growth rate (CAGR) in consolidated revenue and a 60% CAGR in profit after tax (PAT) from FY22 to FY26, reaching Rs 2,998.2 crore of revenue and Rs 723.8 crore of PAT in FY26.
Know BLS International Services inside out
Results, valuation, peers and who's buying, in one view.
How did BLS revenue and profit change from FY22 to FY26?
BLS increased consolidated revenue from operations from Rs 849.9 crore in FY22 to Rs 2,998.2 crore in FY26, while PAT rose from Rs 111.2 crore to Rs 723.8 crore. The presentation states a 37% CAGR for revenue and a 60% CAGR for PAT over FY22 to FY26.
Revenue added Rs 666.3 crore in FY23, Rs 160.6 crore in FY24, Rs 516.5 crore in FY25 and Rs 804.9 crore in FY26. PAT increased by Rs 93.1 crore in FY23, Rs 121.3 crore in FY24, Rs 214 crore in FY25 and Rs 184.2 crore in FY26, making FY26 the highest PAT in the five-year series.
Earnings before interest, tax, depreciation and amortisation (EBITDA) rose from Rs 106.9 crore in FY22 to Rs 818.9 crore in FY26, which the presentation identifies as a 66% CAGR. EBITDA increased by Rs 283.6 crore in FY25 and a further Rs 189.6 crore in FY26, although the absolute addition was lower in the final year.
What changed in BLS margins and costs through FY26?
BLS expanded EBITDA margin from 12.6% in FY22 to 27.3% in FY26 and PAT margin from 13.1% to 24.1%, although both margins were below their FY25 levels. EBITDA margin reached 28.7% in FY25 before falling by 1.4 percentage points in FY26, while PAT margin declined by 0.5 percentage points from 24.6%.
The largest margin expansion occurred between FY23 and FY25. EBITDA margin rose from 14.6% in FY23 to 20.6% in FY24 and 28.7% in FY25, while PAT margin rose from 13.5% to 19.4% and then 24.6% over those years.
FY26 cost of services was Rs 1,381.7 crore, employee benefit expense was Rs 465.6 crore and other expenses were Rs 332.1 crore. Each was above FY25, when the corresponding figures were Rs 986 crore, Rs 323.5 crore and Rs 254.5 crore, alongside revenue growth to Rs 2,998.2 crore from Rs 2,193.3 crore.
Finance costs declined to Rs 23.2 crore in FY26 from Rs 27.8 crore in FY25, while depreciation and amortisation increased to Rs 93.7 crore from Rs 76.5 crore. Other income rose from Rs 80.5 crore to Rs 95.2 crore, profit before tax before exceptional items reached Rs 797.1 crore, and tax expense was Rs 73.3 crore in FY26.
Got a follow-up? Ask IRIS
How did BLS net worth and net cash change?
BLS reported FY26 net worth of Rs 2,463 crore and a net cash balance of Rs 1,434 crore, compared with Rs 570 crore and Rs 407 crore in FY22. Net worth increased in each reported year, while net cash rose through FY24, declined in FY25 and then reached its highest level in FY26.
Net worth increased by Rs 233 crore in FY23, Rs 405 crore in FY24, Rs 523 crore in FY25 and Rs 732 crore in FY26. Net cash rose by Rs 149 crore in FY23 and Rs 579 crore in FY24, fell by Rs 207 crore in FY25, and increased by Rs 506 crore in FY26; the presentation does not explain the annual net-cash movements.
Return on equity increased from 19.5% in FY22 to 31.2% in FY25 before moderating to 29.4% in FY26. The FY26 ratio was still 9.9 percentage points above FY22, alongside the five-year-high PAT of Rs 723.8 crore and net worth of Rs 2,463 crore.
How did BLS Visa and Consular Services perform in FY26?
BLS reported Visa and Consular Services revenue from operations of Rs 1,840.3 crore in FY26, EBITDA of Rs 737.8 crore and an EBITDA margin of 40.1%. Revenue was Rs 1,259.9 crore in FY23, EBITDA was Rs 186.6 crore and the margin was 14.8%, showing expansion across all three measures.
The presentation displays FY23 to FY26 growth of 13% for Visa and Consular Services revenue and 58% for EBITDA. FY26 segment revenue of Rs 1,840.3 crore was lower than consolidated revenue of Rs 2,998.2 crore, while segment EBITDA of Rs 737.8 crore was below consolidated EBITDA of Rs 818.9 crore.
Applications increased from 25.1 lakh in FY23 to 44.1 lakh in FY26, with the presentation displaying growth of 21%. Net revenue per application increased from Rs 1,613 to Rs 3,302, and BLS defines the measure as visa-business revenue less cost of services divided by the number of applications.
The segment's EBITDA margin increased each year shown, rising from 14.8% in FY23 to 22.1% in FY24, 34.5% in FY25 and 40.1% in FY26. This differed from consolidated EBITDA margin, which peaked at 28.7% in FY25 and stood at 27.3% in FY26.
BLS's FY24-present timeline also lists a Slovakia global contract to open visa offices in more than 80 countries and additional Cyprus contracts covering more than 15 countries. These disclosed contract developments provide operating actions alongside FY26 Visa and Consular Services applications of 44.1 lakh.
Conclusion
BLS reported faster growth in PAT than revenue between FY22 and FY26, while EBITDA margin rose from 12.6% to 27.3%, net worth increased from Rs 570 crore to Rs 2,463 crore and net cash increased from Rs 407 crore to Rs 1,434 crore. Visa and Consular Services also recorded higher applications, net revenue per application and EBITDA margin through FY26.
The next measures to watch are Visa and Consular Services applications, net revenue per application and the 40.1% segment EBITDA margin, alongside execution of the disclosed Slovakia plan for offices in more than 80 countries and Cyprus contracts spanning more than 15 countries. At the consolidated level, the presentation does not explain why EBITDA and PAT margins eased from FY25 despite higher FY26 earnings.