










BLS Polymers Ltd. margin reaches 13.33% as leverage falls
Key highlights
- BLS Polymers reported EBITDA margin of 13.33% in FY26, up from 7.10% in FY24.
- BLS Polymers’ debt-to-equity declined from 2.05 times in FY24 to 0.56 times in FY26.
- BLS Polymers’ operating cash flow increased from Rs 2.65 crore in FY24 to Rs 38.06 crore in FY26.
- BLS Polymers’ revenue from operations rose to Rs 349.43 crore in FY26 from Rs 296.35 crore in FY24.
powered by IRIS
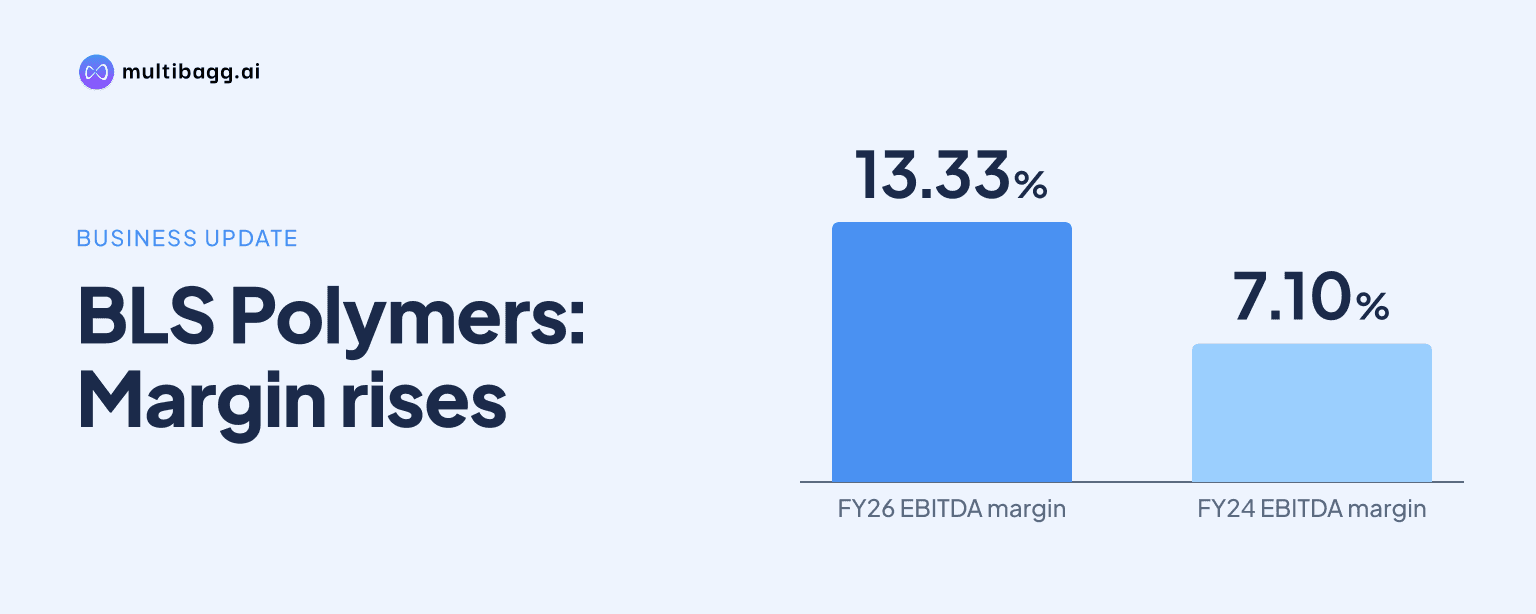
BLS Polymers raised its earnings before interest, tax, depreciation and amortisation (EBITDA) margin to 13.33% in financial year (FY) 26 from 7.10% in FY24 while reducing debt-to-equity to 0.56 times from 2.05 times. Over the same two-year period, revenue rose to Rs 349.43 crore, operating cash flow reached Rs 38.06 crore and profit after tax increased to Rs 27.01 crore.
Know BLS Polymers inside out
Results, valuation, peers and who's buying, in one view.
How did BLS Polymers’ revenue and operating profit change through FY26?
BLS Polymers increased revenue from operations by Rs 53.08 crore from FY24 to FY26, while EBITDA more than doubled from Rs 21.05 crore to Rs 46.88 crore. Revenue rose in each reported year, from Rs 296.35 crore in FY24 to Rs 328.44 crore in FY25 and Rs 349.43 crore in FY26. EBITDA rose more sharply, reaching Rs 39.66 crore in FY25 before increasing a further Rs 7.22 crore in FY26.
Revenue growth slowed in absolute terms between the two periods shown, adding Rs 32.09 crore in FY25 and Rs 20.99 crore in FY26. EBITDA followed a similar pattern, but its FY25 increase of Rs 18.61 crore was substantially larger than the corresponding revenue increase. The presentation supplies the historical outcomes but does not assign the EBITDA change to pricing, input costs, volume or product mix.
How did BLS Polymers’ profitability margins improve from FY24?
BLS Polymers’ EBITDA margin expanded by 6.23 percentage points between FY24 and FY26, rising from 7.10% to 13.33%. The improvement occurred in both years: EBITDA margin reached 12.08% in FY25, up 4.98 percentage points from FY24, and then increased another 1.25 percentage points in FY26. This compares with FY26 revenue from operations of Rs 349.43 crore.
Profit after tax (PAT) margin also improved from 2.54% in FY24 to 7.73% in FY26, a rise of 5.19 percentage points. PAT was Rs 7.52 crore in FY24, Rs 21.14 crore in FY25 and Rs 27.01 crore in FY26. The FY26 PAT margin was 1.29 percentage points above FY25’s 6.44%, meaning the margin progression continued even as revenue growth moderated to Rs 20.99 crore that year.
The difference between EBITDA and PAT remained material in FY26, with EBITDA of Rs 46.88 crore and PAT of Rs 27.01 crore. The presentation reports both measures but provides no separate interest, depreciation, tax or exceptional-item bridge. The reported data therefore show improved operating and net profitability without identifying the components behind the difference between the two profit measures.
How did BLS Polymers reduce its debt-to-equity ratio?
BLS Polymers reduced debt-to-equity from 2.05 times in FY24 to 1.11 times in FY25 and 0.56 times in FY26. The two-year decline was 1.49 times, with the ratio falling in each reported year. The presentation does not disclose the absolute debt or equity balances behind these ratios.
Liquidity measures improved alongside lower debt-to-equity. The current ratio increased from 1.26 times in FY24 to 1.66 times in FY26, while net asset value (NAV) per share rose from Rs 10.40 to Rs 21.08. Operating cash flow increased from Rs 2.65 crore to Rs 38.06 crore, including a Rs 12.93 crore increase from FY25’s Rs 25.13 crore.
Got a follow-up? Ask IRIS
What do BLS Polymers’ returns and cash flow show?
BLS Polymers’ return on capital employed (RoCE) rose from 12.84% in FY24 to 29.51% in FY26, while return on equity (RoE) increased from 17.48% to 33.17%. RoCE advanced in each reported year, reaching 25.46% in FY25 before its FY26 increase of 4.05 percentage points. The presentation presents these as return ratios and does not give the underlying capital-employed calculation.
RoE followed a different annual pattern from RoCE. It climbed to 36.83% in FY25, then declined 3.66 percentage points to 33.17% in FY26, although it remained 15.69 percentage points above FY24. Earnings per share (EPS) increased in every year from Rs 1.67 in FY24 to Rs 4.69 in FY25 and Rs 5.99 in FY26, alongside FY26 PAT of Rs 27.01 crore.
Operating cash flow exceeded PAT in both FY25 and FY26, at Rs 25.13 crore versus Rs 21.14 crore in FY25 and Rs 38.06 crore versus Rs 27.01 crore in FY26. In FY24, the relationship was reversed, with operating cash flow of Rs 2.65 crore compared with PAT of Rs 7.52 crore. These figures show a material change in the reported cash-flow outcome over the three financial years, without disclosing working-capital movements or capital expenditure.
What is BLS Polymers’ plan after FY26?
BLS Polymers identifies a shift from basic polymers towards specialised application-based compounds, particularly for pipe coating and cable applications. Its stated offerings include halogen-free flame-retardant (HFFR) compounds; cross-linked polyethylene (XLPE) compounds; polyvinyl chloride (PVC) compounds; and polyethylene (PE) compounds. HFFR products are described for cable insulation, while XLPE is described for power-cable insulation.
BLS Polymers exports to 13 countries and says it plans to enter markets including Tunisia and Nigeria to diversify revenue and extend its international reach. It also cites its port location as reducing raw-material transportation costs through strategic positioning. Those market and procurement features are part of management’s stated operating plan, rather than a quantified forecast of revenue or margins.
For FY28, BLS Polymers states an aim to strengthen its position in polymer compounding through product innovation, manufacturing excellence, domestic and international expansion, customer diversification and sustainable profitable growth. The FY28 vision contains no numerical revenue, EBITDA, debt or cash-flow target. FY26 therefore provides the latest completed annual baseline for assessing whether the strategy produces further financial progress.
Conclusion
The FY24-to-FY26 record shows a combined improvement in BLS Polymers’ reported profitability, cash generation and leverage measures. Revenue increased by Rs 53.08 crore to Rs 349.43 crore, EBITDA margin rose from 7.10% to 13.33%, operating cash flow rose from Rs 2.65 crore to Rs 38.06 crore, and debt-to-equity fell from 2.05 times to 0.56 times.
The next disclosed items to watch are BLS Polymers’ FY28 strategy, its intended expansion beyond 13 export countries into Tunisia and Nigeria, and progress in specialised cable and pipe-coating compounds. Since management has not published numerical FY28 financial targets, subsequent revenue, margin, operating cash flow and debt-to-equity disclosures will show how the plan translates into reported results.