










Bonfiglioli raises EBITDA margin to 19.7% during 9M CY26
Key highlights
- Bonfiglioli reported a 19.7% EBITDA margin in 9M CY26, compared with 14.5% in CY23.
- Bonfiglioli generated Rs 353.4 crore of EBITDA and Rs 235.7 crore of PAT in 9M CY26.
- Bonfiglioli held Rs 139.4 crore of net cash at June 30, 2026.
- Bonfiglioli's return on capital employed increased from 24.5% in CY23 to 34.1% in CY25.
powered by IRIS
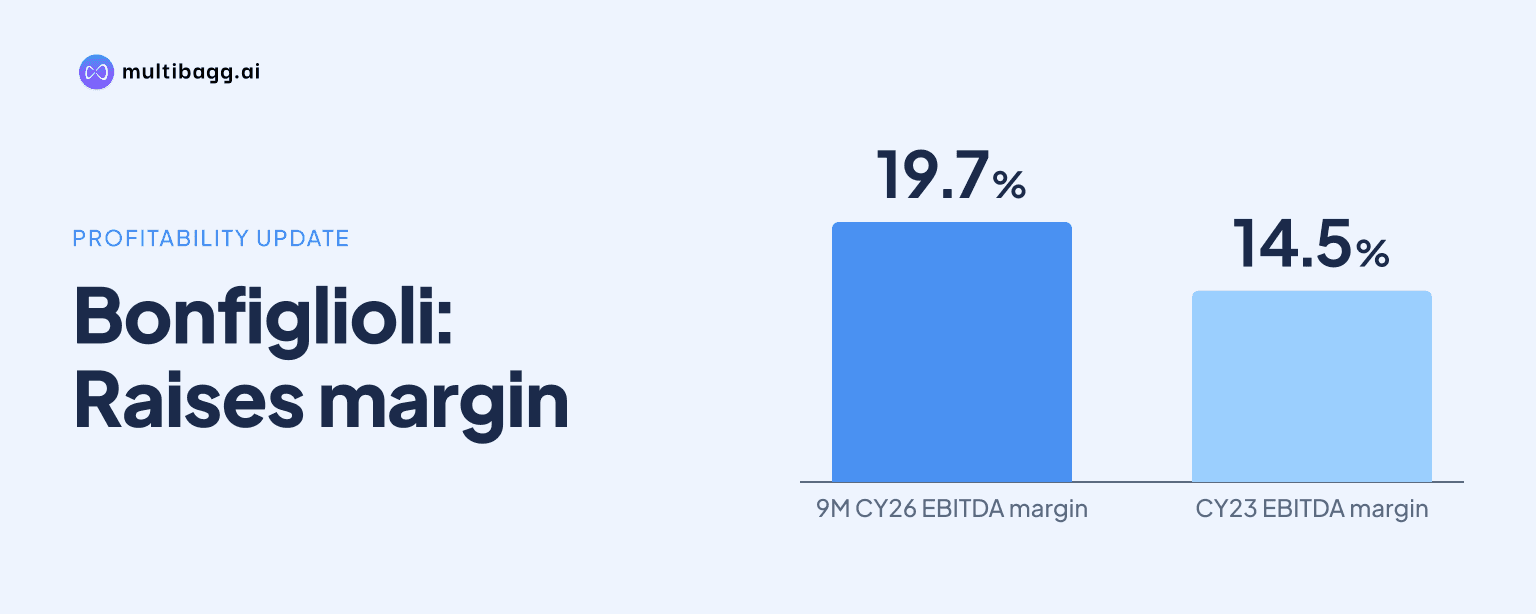
Bonfiglioli Transmissions Limited raised its EBITDA margin to 19.7% in 9M CY26 from 14.5% in CY23, while holding net cash of Rs 139.4 crore at June 30, 2026. Revenue was Rs 1,792 crore and profit after tax was Rs 235.7 crore in the nine-month period.
Know Bonfiglioli Transmissions inside out
Results, valuation, peers and who's buying, in one view.
How did Bonfiglioli's profitability change?
Bonfiglioli expanded its EBITDA margin by 5.2 percentage points from CY23 to 9M CY26, with EBITDA rising from Rs 243.9 crore to Rs 353.4 crore. The presentation defines EBITDA as earnings before interest, tax, depreciation and amortisation excluding other income.
Revenue rose from Rs 1,687.3 crore in CY23 to Rs 2,013.5 crore in CY25, while EBITDA increased from Rs 243.9 crore to Rs 370.8 crore over the same full-year comparison. EBITDA margin moved to 15.9% in CY24 and 18.4% in CY25, before reaching 19.7% in 9M CY26.
Bonfiglioli's profit after tax, or PAT, margin increased from 8.7% in CY23 to 10.5% in CY24 and 11.8% in CY25. PAT reached Rs 235.7 crore, or 13.1% of revenue, in 9M CY26; this nine-month result is not directly comparable with a full calendar year.
Finance cost declined from Rs 13.1 crore in CY23 to Rs 7.8 crore in CY25 and Rs 6.4 crore in 9M CY26. Earnings before interest and tax margin rose from 12.3% in CY23 to 17.5% in 9M CY26, while depreciation and amortisation expense was Rs 40.3 crore in the nine-month period.
Which revenue segments contributed to Bonfiglioli's mix?
Bonfiglioli's Industry & Automation Solutions was its largest reported vertical, contributing 42.0% of revenue in 9M CY26, compared with 41.0% in CY25. Off-Highway Mobility Industry accounted for 29.4%, up from 25.2% in CY25, while Wind Industry's share declined to 26.8% from 31.5%.
The comparison is between Rs 1,792 crore of revenue in 9M CY26 and Rs 2,013.5 crore for the full CY25 period. Others represented 1.9% of 9M CY26 revenue, versus 2.3% in CY25, leaving the three main verticals with a combined 98.2% share in the nine-month period.
Bonfiglioli states that no industry accounts for more than 10% of Industry & Automation Solutions revenue. Its top 10 customers represented 31.7% of revenue in H1 CY26, while new products accounted for 29.7% of revenue in the same half-year.
Exports reached 30.6% of revenue in 9M CY26, and Bonfiglioli reported exports to 18 countries. Management's growth priorities cite automation, biogas, warehousing and onshore wind as areas where Financial & Services is targeting 10% to 15% growth.
Got a follow-up? Ask IRIS
What do Bonfiglioli's returns and working capital show?
Bonfiglioli's return on capital employed rose to 34.1% in CY25 from 24.5% in CY23, while fixed-asset turnover increased to 7.2 times from 6.1 times. The presentation notes that a new assembly facility was established at Pune in the fourth quarter of CY23.
The return metrics increased alongside a longer cash conversion cycle, which moved from 80 days in CY23 to 83 days in CY24 and 90 days in CY25. Bonfiglioli defines the cycle as receivable days plus inventory days minus payable days, calculated using revenue from operations, cost of goods sold, and purchases of raw materials, components and stock-in-trade.
At June 30, 2026, Bonfiglioli reported inventory of Rs 377.6 crore and trade receivables of Rs 532.5 crore. Those balances were Rs 319.2 crore and Rs 517.7 crore, respectively, at December 31, 2025, while trade payables increased from Rs 330.2 crore to Rs 371.2 crore.
Total assets increased to Rs 1,495.8 crore at June 30, 2026 from Rs 1,439.5 crore at December 31, 2025. Total equity rose from Rs 993 crore to Rs 1,034.3 crore over the same dates, while total liabilities increased from Rs 446.5 crore to Rs 461.6 crore.
How much did Bonfiglioli retain after capital expenditure?
Bonfiglioli reported EBITDA less capital expenditure, or CapEx, of Rs 316.8 crore in CY25 and Rs 183 crore in H1 CY26. The corresponding EBITDA-minus-CapEx conversion was 85% in CY25 and 82% in H1 CY26, which the presentation labels as not annualised.
The company defines EBITDA-minus-CapEx as EBITDA excluding other income less purchases of property, plant and equipment and intangible assets. Conversion improved from 51% in CY23 to 85% in CY24 and remained at 85% in CY25; the CY23 amount was Rs 123.8 crore, when the presentation cites higher CapEx for the Pune assembly facility.
Bonfiglioli held Rs 139.4 crore of net cash at June 30, 2026, compared with Rs 138.2 crore at December 31, 2025 and Rs 183 crore at December 31, 2023. Net cash is defined as cash and bank balances less borrowings and lease liabilities, and the balance sheet showed no borrowings at June 30, 2026.
The company's debt-free statement is based on total borrowings at June 2026 and excludes non-fund-based bank guarantees and letters of credit. Bonfiglioli reported cash and cash equivalents of Rs 140.2 crore at June 30, 2026, compared with Rs 153.2 crore at December 31, 2025.
Bonfiglioli also reported an interim H1 CY26 dividend of Rs 5.9 per share and aggregate dividends of Rs 110 crore after bonus share issues. This compares with Rs 7.4 per share and Rs 92.7 crore in aggregate dividends for CY25; the dividend-per-share figures exclude share buybacks.
Conclusion
Bonfiglioli's reported figures show a rise in operating profitability, PAT margin and return on capital from CY23 through CY25, followed by a 19.7% EBITDA margin in 9M CY26. Its revenue mix shifted towards Off-Highway Mobility Industry, while Industry & Automation Solutions remained the largest vertical and the company retained Rs 139.4 crore of net cash at June 2026.
The disclosed items to watch are management's planned investment of more than Rs 100 crore in each of CY26 and CY27, and its ambition of about 15% revenue compound annual growth. Investors can also track whether the cash conversion cycle changes from the 90 days reported for CY25 and whether exports build on their 30.6% revenue share in 9M CY26.