










Brookfield India REIT NOI rise was driven by consolidation
Key highlights
- Brookfield India REIT’s Q2 FY2027 NOI rose 50.6% year on year to Rs 767.2 crore.
- Ecoworld and GBKC Floors’ SPV contributed Rs 218.1 crore of the Rs 257.8 crore quarterly NOI increase.
- Leasing, occupancy and inflationary factors contributed Rs 39.7 crore, or 7.8%, to Q2 FY2027 NOI growth.
- Brookfield India REIT’s Q2 FY2027 distribution per unit was Rs 5.70, versus Rs 5.60 in Q1 FY2027.
powered by IRIS
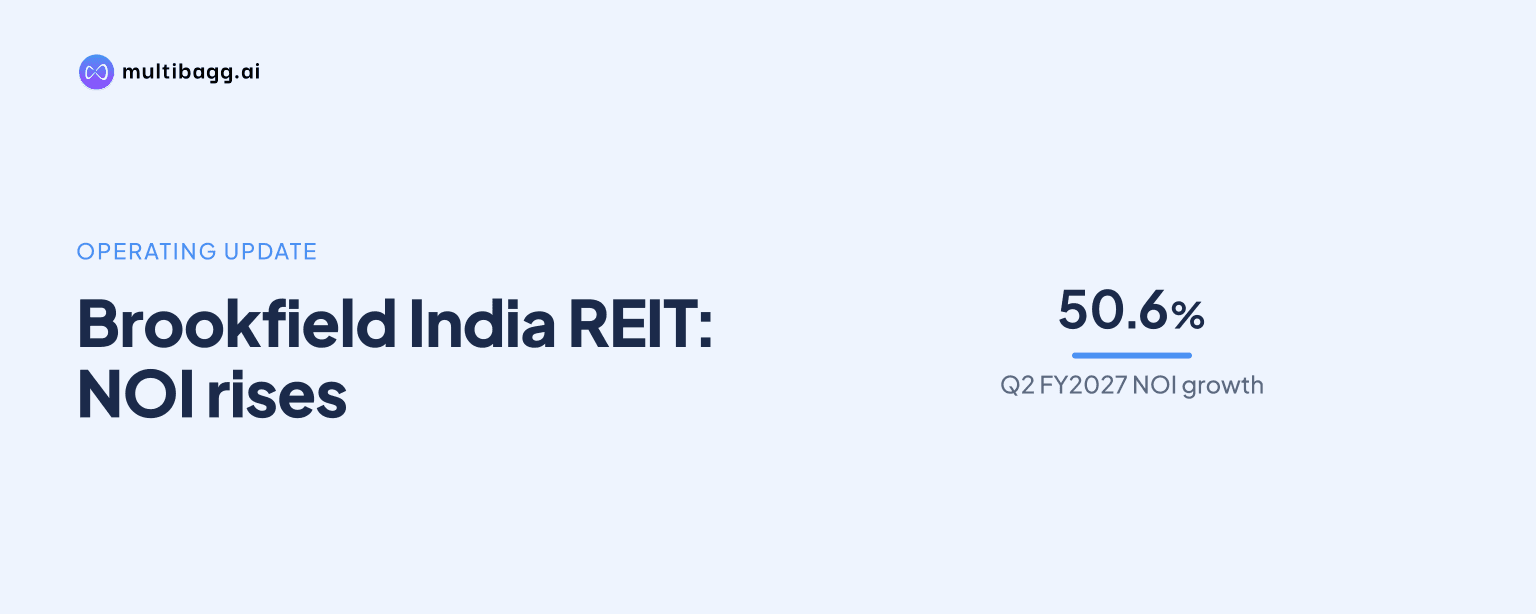
Brookfield India REIT’s Q2 FY2027 net operating income rose 50.6% year on year to Rs 767.2 crore, but Rs 218.1 crore, equivalent to 42.8% growth on the prior-year NOI base, came from Ecoworld and GBKC Floors’ special purpose vehicle, while leasing, occupancy and inflationary growth contributed Rs 39.7 crore.
Know Brookfield India Real Estate Trust inside out
Results, valuation, peers and who's buying, in one view.
Why did Brookfield India REIT’s quarterly NOI rise 50.6%?
Brookfield India REIT’s quarterly net operating income, or NOI, increased primarily because Ecoworld and GBKC Floors’ special purpose vehicle, or SPV, contributed most of the reported increase. Q2 FY2027 NOI was Rs 767.2 crore, up Rs 257.8 crore from Q2 FY2026. The presentation attributes Rs 218.1 crore of that gain to Ecoworld and GBKC Floors’ SPV and Rs 39.7 crore to higher operating lease rentals and better common-area-maintenance, or CAM, margins.
The Rs 39.7 crore operational contribution was linked to improved occupancy and inflationary growth, alongside lease rentals and CAM margin. This represented 7.8% year-on-year NOI growth, compared with 42.8% associated with the SPV. The disclosed split shows that the 50.6% reported NOI increase combined portfolio operating growth with the addition of Ecoworld and GBKC Floors’ SPV.
Operating lease rentals, or OLR, reached Rs 722.1 crore in Q2 FY2027, a 52.1% year-on-year increase. Of the Rs 247.3 crore OLR increase, recent leasing, renewals and escalations, net of expiries, provided Rs 26.6 crore, while Ecoworld and GBKC Floors’ SPV supplied Rs 220.7 crore. Revenue from operations rose 48.3% to Rs 996.4 crore, with Rs 285.2 crore of its Rs 324.5 crore increase attributed to the same SPV.
How did operational growth compare with portfolio consolidation?
Operational gains were positive but substantially smaller than the Ecoworld and GBKC Floors’ SPV contribution in Q2 FY2027. The presentation identifies Rs 26.6 crore of OLR growth from new leasing, renewals and escalations after expiries, equal to 5.6% growth, while the SPV contributed 46.5% growth. For NOI, the comparable operational contribution was 7.8%, as higher occupancy also improved CAM margin.
The distinction arises because OLR captures rental income, whereas NOI also reflects CAM revenue less direct CAM and other expenses. In Q2 FY2027, revenue from operations increased by Rs 324.5 crore, while NOI increased by Rs 257.8 crore. The difference reflects, among other items, higher direct CAM and other expenses associated with occupancy, inflation and Ecoworld and GBKC Floors’ SPV.
The first-half figures show the same composition over a longer period. H1 FY2027 NOI rose 51.2% to Rs 1,523.8 crore from Rs 1,008 crore in H1 FY2026, an increase of Rs 515.8 crore. Ecoworld and GBKC Floors’ SPV accounted for Rs 435.3 crore, or 43.2% growth, while higher OLR and CAM margin from occupancy and inflation accounted for Rs 80.5 crore, or 8.0% growth.
Got a follow-up? Ask IRIS
Did NOI continue to increase during Q2 FY2027?
NOI continued to increase sequentially in Q2 FY2027, rising to Rs 767.2 crore from Rs 756.6 crore in Q1 FY2027, a Rs 10.6 crore increase. OLR increased by Rs 8.1 crore to Rs 722.1 crore, while CAM and other revenue increased by Rs 14.4 crore to Rs 274.3 crore. Direct CAM and other expenses also rose by Rs 11.8 crore to Rs 229.1 crore.
Earnings before interest, tax, depreciation and amortisation, or EBITDA, was Rs 760.1 crore in Q2 FY2027, compared with Rs 748.5 crore in Q1 FY2027. Cash flow from operations declined to Rs 738.7 crore from Rs 744.6 crore, reflecting a Rs 10.8 crore working-capital and other Indian Accounting Standards adjustments outflow in Q2, compared with a Rs 9.1 crore inflow in Q1.
Net distributable cash flow, or NDCF, at the SPV level rose from Rs 524.4 crore in Q1 to Rs 553 crore in Q2. After partners’ share, retained cash and the distribution received from the North Commercial Portfolio, NDCF distributed to the REIT increased from Rs 477 crore to Rs 495.7 crore. The North Commercial Portfolio is accounted for through the equity method and is excluded from the OLR and NOI figures in the financial highlights.
What did the quarterly cash flow mean for distributions?
Brookfield India REIT reported NDCF distributable at REIT level of Rs 473 crore in Q2 FY2027, compared with Rs 464.7 crore in Q1 FY2027. The Q2 amount included Rs 495.7 crore of cash flows received from SPVs and the holding company, offset by Rs 40.9 crore of external-debt interest, with Rs 1.2 crore of net treasury income and Rs 17 crore of available cash utilization.
Distribution per unit was Rs 5.70 in Q2 FY2027, up from Rs 5.60 in Q1 FY2027. For H1 FY2027, NDCF distributable was Rs 937.8 crore and distribution per unit was Rs 11.30. The presentation shows that distributable cash flow per unit equalled the distribution per unit in both quarters, while the reported NOI figures exclude the North Commercial Portfolio’s rental and NOI contribution.
Conclusion
Brookfield India REIT reported a material Q2 FY2027 NOI increase, but the disclosures show that Ecoworld and GBKC Floors’ SPV, rather than portfolio operating factors alone, was the principal driver. Of the Rs 257.8 crore year-on-year NOI gain, Rs 218.1 crore came from the SPV, while Rs 39.7 crore reflected leasing, occupancy, CAM margin and inflationary effects across the portfolio.
The next operating markers disclosed by Brookfield India REIT are future lease expiries and renewal activity. About 28% of contracted rentals are due for expiry through FY2030, while the REIT had secured 1.2 million square feet of commitments for renewal or re-leasing of future H2 FY2027 and FY2028 expiries; the presentation also lists an expected 8% mark-to-market spread for H2 FY2027 expiries.