










Capri Global’s Q2 Profit Rises 77% as Cost Ratio Falls
Key highlights
- Capri Global reported Q2 FY ’27 profit after tax of Rs. 418 crores, up 77% year-on-year.
- Capri Global’s cost-to-income ratio fell to 41% in Q2 FY ’27 from 49% in Q2 FY ’26.
- Capri Global’s consolidated AUM reached Rs. 43,878 crores, up 62% year-on-year.
- Capri Global’s gold-loan AUM reached Rs. 21,000 crores, up 102% year-on-year.
powered by IRIS
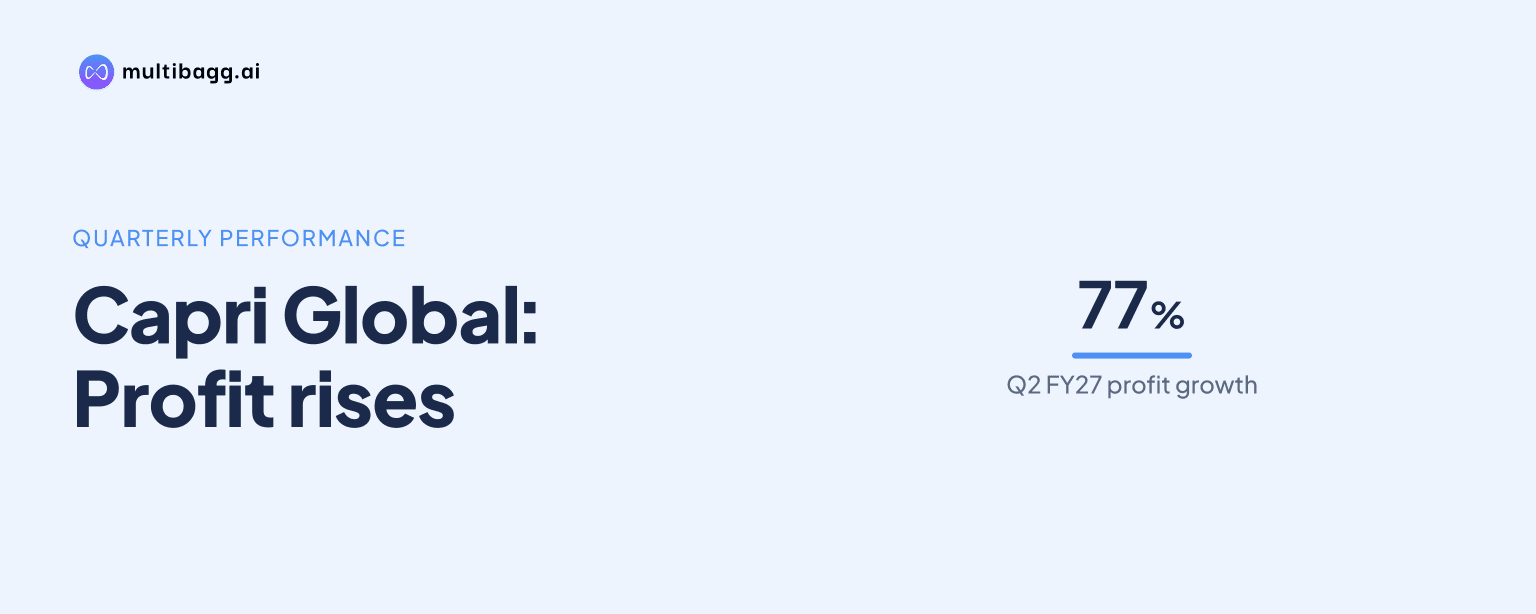
Capri Global Capital Limited reported its highest-ever quarterly profit after tax of Rs. 418 crores in Q2 FY ’27, up 77% year-on-year, as blended yields reached 17.5%, net interest income rose 69% to Rs. 812 crores and cost-to-income declined to 41% from 49% a year earlier.
Know Capri Global Capital inside out
Results, valuation, peers and who's buying, in one view.
How did Capri Global increase Q2 FY ’27 profit?
Capri Global increased Q2 FY ’27 profit after tax by 77% year-on-year to Rs. 418 crores through higher lending income, fee income and lower costs relative to income. Pre-provision operating profit rose 84% year-on-year to Rs. 636 crores, while consolidated assets under management, or AUM, increased 62% year-on-year and 9% quarter-on-quarter to Rs. 43,878 crores.
Net interest income rose 69% year-on-year to Rs. 812 crores in Q2 FY ’27 as loan-book growth combined with a higher share of high-yield products. Blended yield on net advances reached 17.5% and spread reached 8.3%, according to management, which also cited competitive funding costs despite a 25-basis-point Reserve Bank of India repo-rate increase during the quarter.
Non-interest income grew 34% year-on-year to Rs. 273 crores and represented 25% of net total income in Q2 FY ’27. Insurance distribution produced Rs. 51 crores of net fee income, while co-lending and direct-assignment income was Rs. 72 crores, up 11% quarter-on-quarter, adding fee revenue alongside interest income.
For H1 FY ’27, profit after tax was Rs. 772 crores, which management said was almost double the prior-year level. Return on average equity increased to 21.6% in Q2 FY ’27 from 14.4% a year earlier, and return on average assets rose to 4.4% from 4.0%.
Why did Capri Global’s cost-to-income ratio fall to 41%?
Capri Global’s cost-to-income ratio fell to 41% in Q2 FY ’27 from 44% in Q1 FY ’27 and 49% in Q2 FY ’26 because income grew faster than operating expenses. Operating expenses increased 7% quarter-on-quarter after the company added 1,477 employees and 176 net branches, but management attributed the ratio decline to technology investment, maturing branches, productivity and operating leverage.
The network reached 1,609 locations in Q2 FY ’27, including 1,154 dedicated gold-loan branches. Gold-loan AUM reached Rs. 21,000 crores, up 10% quarter-on-quarter, although aggregate branch productivity declined to Rs. 18.2 crores per branch from Rs. 19.2 crores as recently opened branches had not reached full operating velocity.
Gold-loan employee productivity rose to Rs. 3.4 crores from Rs. 1.8 crores a year earlier, while more than 86% of the branch network was profitable. Collateral in custody increased 28% year-on-year to 21 tonnes, giving the business a larger operating base even as the network expanded.
Digital activity also increased. The Capri loan application handled more than 17 lakh transactions worth about Rs. 594 crores in Q2 FY ’27, with transaction value up 47% quarter-on-quarter; September monthly transaction value was Rs. 219 crores, compared with Rs. 106 crores in January.
Got a follow-up? Ask IRIS
Which businesses drove Capri Global’s lending growth?
Capri Global’s lending growth was led by gold loans, while housing, construction finance, micro, small and medium enterprise, or MSME, lending and co-lending also expanded. Gold-loan AUM grew 102% year-on-year to Rs. 21,000 crores, the largest disclosed lending book, while quarterly disbursements across the company rose 49% year-on-year to Rs. 13,309 crores.
Housing AUM rose 39% year-on-year to Rs. 8,325 crores, construction-finance AUM grew 51% to Rs. 7,503 crores and MSME AUM increased 25% to Rs. 7,016 crores. The comparison shows that gold loans grew faster than the other disclosed businesses, while the other three books still added to the 62% group AUM increase.
Within MSME, Micro-LAP, or micro loan against property, AUM reached Rs. 929 crores at the end of Q2 FY ’27. MSME disbursements rose 36% year-on-year to Rs. 560 crores after expansion into Delhi, Uttar Pradesh, Mumbai and Pune, while management said it was refining sourcing toward higher-tier customers and larger average ticket sizes.
Co-lending AUM increased 60% year-on-year and 12% quarter-on-quarter to Rs. 9,083 crores, representing 21% of total AUM. Direct assignment accounted for 28% of co-lending AUM, and management said it could offset temporary disbursement softness as partner banks transition to new co-lending agreement guidelines.
What could affect Capri Global’s profitability next?
Capri Global identified insurance-distribution regulation and the transition to revised co-lending arrangements as matters that could affect future profitability. Management said the Insurance Regulatory and Development Authority of India consultation paper primarily concerned distributor governance, sales monitoring, customer disclosure, audit trails, reporting and compliance, rather than a fundamental change to the distribution model.
If the proposed insurance rules are implemented, management expects consolidated return on average equity to decline by about 1% in FY ’28 and FY ’29. It said FY ’27 was not likely to see much impact, and noted that its core earnings were anchored in retail lending businesses including gold loans, housing finance, MSME lending and co-lending.
The company’s co-lending partners have begun moving to new guidelines that took effect on January 1, 2026, with more than half of partner banks already transitioned. Management said the process may temporarily soften co-lending disbursements, although direct assignment and partner-bank demand for priority-sector-lending compliant loan assets could provide an offset.
Funding costs also remain relevant to spreads. Cost of borrowings increased marginally quarter-on-quarter to 9.2%, while borrowings rose 82% year-on-year and Capri Global reported more than 40 lender relationships and Rs. 6,057 crores of consolidated cash, bank balances, investments and undrawn credit lines.
Conclusion
Capri Global’s Q2 FY ’27 result combined rapid balance-sheet growth with greater income per unit of operating cost. Profit after tax reached Rs. 418 crores as net interest income grew to Rs. 812 crores, non-interest income reached Rs. 273 crores and the cost-to-income ratio declined to 41%, despite hiring 1,477 employees and adding 176 net branches.
Next, investors can watch whether the branch expansion plan supports continuing productivity gains and whether co-lending disbursements remain stable during the guideline transition. Management expects to end the financial year with approximately 1,500 gold-loan branches, while the potential FY ’28 and FY ’29 impact of the proposed insurance-distribution rules remains contingent on their implementation.