










Carysil operating cash flow falls to Rs 65.2 crore in H1 FY27
Key highlights
- Carysil’s H1 FY27 net cash from operating activities was Rs 65.2 crore, down from Rs 71.4 crore in H1 FY26.
- Working-capital changes used Rs 32.9 crore in H1 FY27, compared with Rs 9.2 crore in H1 FY26.
- Consolidated trade receivables increased by Rs 40.4 crore to Rs 201.1 crore between March and September 2026.
- Carysil’s H1 FY27 profit after tax increased 21.3% to Rs 61.1 crore.
powered by IRIS
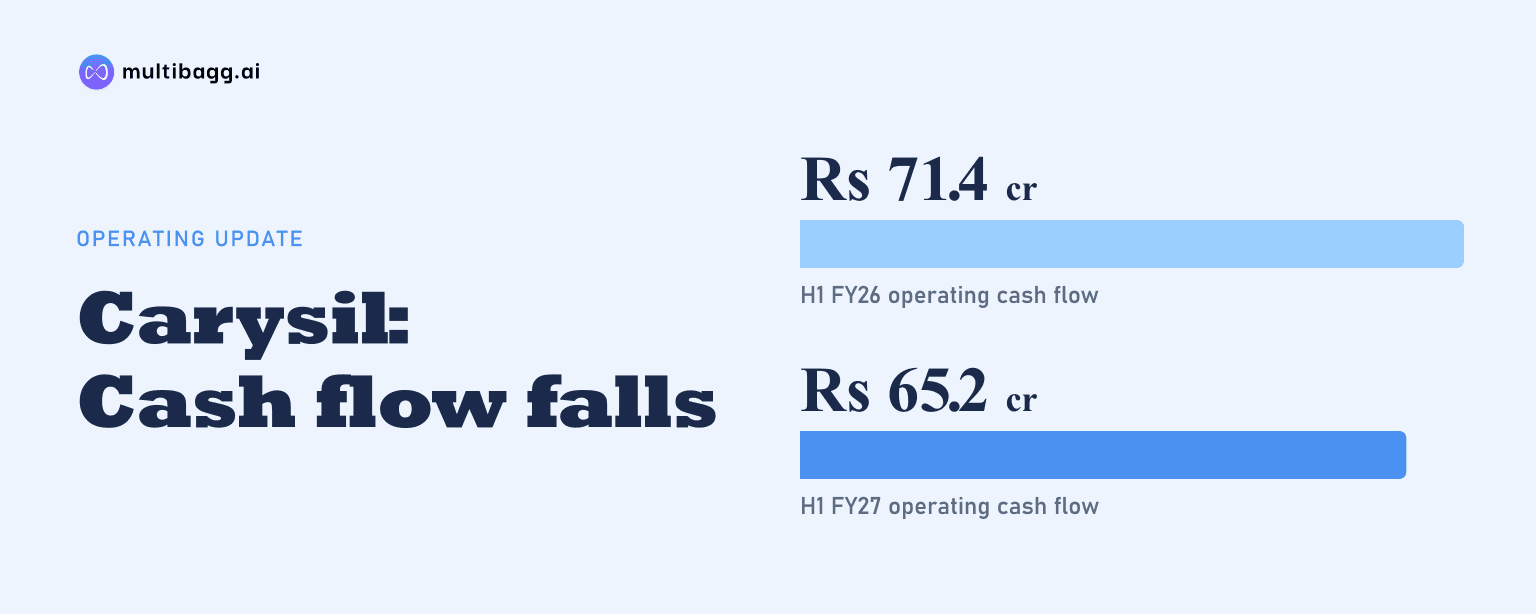
CARYSIL recorded Rs 65.2 crore of consolidated net cash from operating activities in H1 FY27, down from Rs 71.4 crore in H1 FY26, as working-capital changes absorbed Rs 32.9 crore despite profit after tax rising 21.3% to Rs 61.1 crore.
Know Carysil inside out
Results, valuation, peers and who's buying, in one view.
Why did Carysil’s operating cash flow fall in H1 FY27?
Carysil’s operating cash flow fell because changes in working capital used Rs 32.9 crore in H1 FY27, compared with a Rs 9.2 crore use in H1 FY26. The Rs 23.7 crore larger cash absorption outweighed the Rs 21.1 crore increase in operating profit before working-capital changes, which rose to Rs 111.1 crore from Rs 90.0 crore.
Cash generated from operations was Rs 78.2 crore in H1 FY27, compared with Rs 80.8 crore a year earlier. Direct taxes paid, net of refunds, also rose to Rs 13.0 crore from Rs 9.5 crore, resulting in net cash from operating activities of Rs 65.2 crore, down Rs 6.2 crore year on year.
The reported profit trend was different from the operating-cash trend. Consolidated profit after tax increased to Rs 61.1 crore in H1 FY27 from Rs 50.3 crore in H1 FY26, while operating cash declined because the working-capital outflow rose and net tax payments increased by Rs 3.5 crore.
What changed in Carysil’s working-capital balances?
Carysil’s consolidated trade receivables increased to Rs 201.1 crore at September 2026 from Rs 160.7 crore at March 2026, a rise of Rs 40.4 crore. This increase coincided with the larger working-capital cash outflow, although the cash-flow statement does not allocate its Rs 32.9 crore working-capital movement to individual balance-sheet accounts.
Inventories moved in the opposite direction, declining by Rs 2.5 crore to Rs 256.6 crore at September 2026. Trade payables rose by Rs 19.0 crore to Rs 120.6 crore, while other current assets increased by Rs 9.6 crore to Rs 45.7 crore, showing that several current-account balances changed during the six-month period.
Total current assets increased to Rs 531.6 crore at September 2026 from Rs 521.3 crore at March 2026, while current liabilities rose to Rs 365.8 crore from Rs 361.7 crore. The excess of current assets over current liabilities consequently increased by Rs 6.2 crore, but this balance-sheet movement is not a reconciliation to the Rs 32.9 crore cash-flow line disclosed for working capital.
How did Carysil’s earnings compare with operating cash generation?
Carysil’s consolidated revenue increased 15.0% to Rs 537.9 crore in H1 FY27, while earnings before interest, tax, depreciation and amortisation, or EBITDA, rose 17.6% to Rs 110.1 crore. EBITDA margin increased by 42 basis points to 20.3%, and profit after tax rose 21.3% to Rs 61.1 crore.
Net cash from operating activities was Rs 65.2 crore, or Rs 4.1 crore above H1 FY27 profit after tax. In H1 FY26, operating cash of Rs 71.4 crore was Rs 21.1 crore above profit after tax of Rs 50.3 crore, illustrating the reduced cash generation relative to reported profit across the two periods.
Non-cash items and other investment or financial adjustments added Rs 50.0 crore in H1 FY27, compared with Rs 39.7 crore in H1 FY26. Those additions helped operating profit before working-capital changes increase by Rs 21.1 crore, before the Rs 32.9 crore working-capital outflow reduced cash generated from operations.
Got a follow-up? Ask IRIS
What happened to Carysil’s cash, investing and financing flows?
Carysil ended H1 FY27 with Rs 11.7 crore of cash and cash equivalents, up from Rs 7.6 crore at the beginning of the period. The Rs 4.0 crore net increase reflected Rs 65.2 crore of operating inflow, offset by Rs 16.8 crore of investing outflow and Rs 44.4 crore of financing outflow.
Investing cash outflow was Rs 16.8 crore in H1 FY27, lower than Rs 23.9 crore in H1 FY26, while financing outflow declined to Rs 44.4 crore from Rs 50.9 crore. In the prior half year, the combination of Rs 71.4 crore of operating inflow, Rs 23.9 crore of investing outflow and Rs 50.9 crore of financing outflow led to a Rs 3.4 crore reduction in cash and cash equivalents.
Cash and cash equivalents were separate from bank balances other than cash equivalents on Carysil’s balance sheet. Bank balances other than cash equivalents fell to Rs 12.4 crore at September 2026 from Rs 51.0 crore at March 2026, while cash and cash equivalents increased to Rs 11.7 crore from Rs 7.6 crore; the presentation does not provide a reason for the separate bank-balance movement.
How did Carysil’s borrowings and capital base change?
Carysil’s current borrowings declined to Rs 196.2 crore at September 2026 from Rs 222.5 crore at March 2026, while non-current borrowings increased to Rs 49.2 crore from Rs 47.1 crore. Combined borrowings therefore declined by Rs 24.2 crore to Rs 245.4 crore over the six-month balance-sheet period.
Total equity rose to Rs 666.0 crore at September 2026 from Rs 614.4 crore at March 2026, including other equity of Rs 653.1 crore compared with Rs 602.7 crore. Capital work in progress increased to Rs 41.9 crore from Rs 25.3 crore and property, plant and equipment rose to Rs 313.2 crore from Rs 310.5 crore.
Current liabilities increased by Rs 4.1 crore to Rs 365.8 crore at September 2026. The Rs 19.0 crore increase in trade payables was partly offset by the Rs 26.3 crore reduction in current borrowings, while current tax liabilities increased to Rs 16.4 crore from Rs 9.4 crore.
Conclusion
Carysil’s H1 FY27 disclosures show higher revenue, EBITDA and profit after tax alongside lower operating cash flow. The key disclosed difference was the Rs 32.9 crore working-capital outflow, which was Rs 23.7 crore larger than in H1 FY26, while receivables increased by Rs 40.4 crore and operating cash declined by Rs 6.2 crore.
The next figures to watch are receivables, working-capital changes and operating cash flow as Carysil pursues its 2028 plan for domestic and international partnerships, distribution-led expansion, product-mix upgrades and manufacturing-scale efficiencies. The FY28E slide also lists EBITDA-margin entries of 20% and 18%, without explaining the distinction between the two figures.