










Cellecor H1 sales rose 16%, but profit grew only 1.5%
Key highlights
- Cellecor's H1 FY27 net sales rose 16.4% year on year to Rs 746.8 crore.
- Cellecor's H1 FY27 PAT increased 1.5% to Rs 19.9 crore.
- Cellecor's finance costs rose to Rs 14.6 crore from Rs 6.9 crore in H1 FY26.
- Cellecor's H1 FY27 PAT margin was 2.7%, compared with 3.1% in H1 FY26.
powered by IRIS
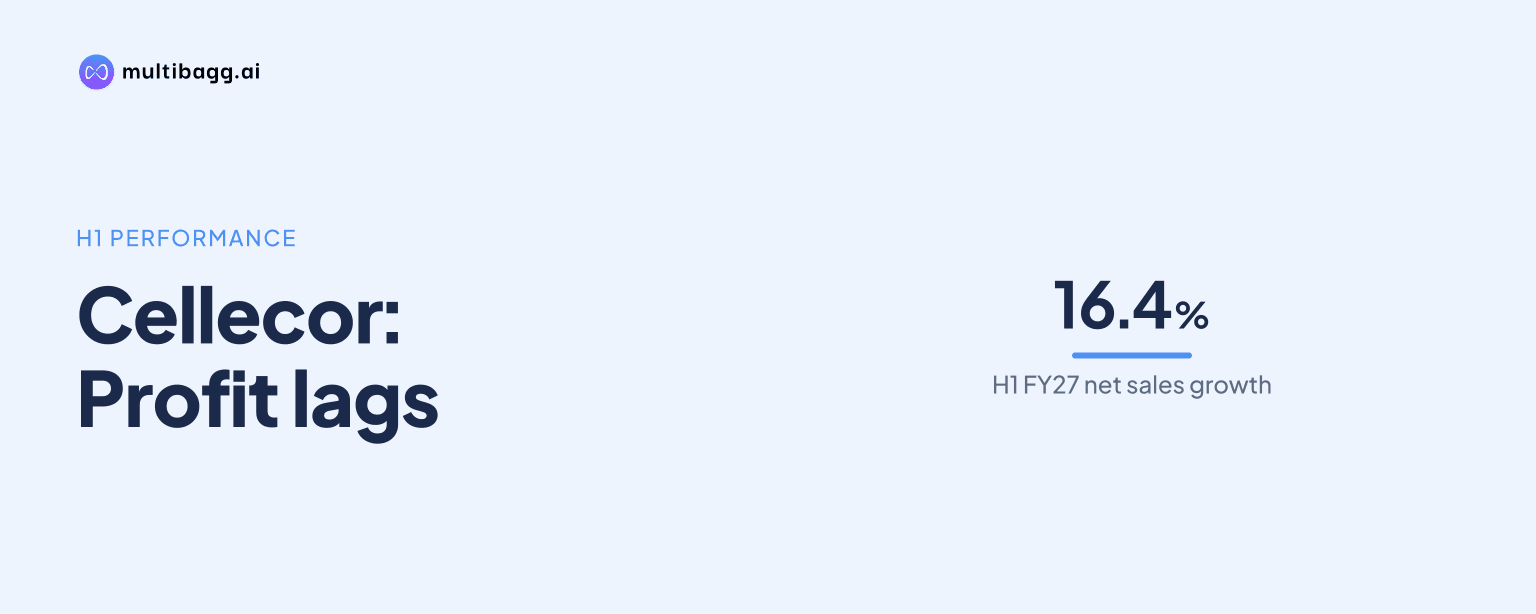
Cellecor Gadgets Limited reported H1 FY27 net sales of Rs 746.8 crore, up 16.4% year on year, while profit after tax rose only 1.5% to Rs 19.9 crore as management cited increased marketing investment and higher input costs, and finance costs increased to Rs 14.6 crore.
Know Cellecor Gadgets inside out
Results, valuation, peers and who's buying, in one view.
Why did Cellecor's H1 FY27 profit trail sales growth?
Cellecor's profit trailed sales because higher operating earnings were offset by a Rs 7.7 crore increase in finance costs alongside management's stated marketing and input-cost pressures. Net sales increased to Rs 746.8 crore in H1 FY27 from Rs 641.5 crore in H1 FY26, but profit after tax, or PAT, rose only to Rs 19.9 crore from Rs 19.6 crore. The figures are standalone because the presentation says subsidiaries had not commenced business operations.
Total income rose 16.9% to Rs 750.3 crore in H1 FY27 from Rs 641.6 crore a year earlier, including other income of Rs 3.5 crore against Rs 0.1 crore. The Rs 3.4 crore rise in other income did not translate into a comparable increase in PAT, which was Rs 0.3 crore higher year on year.
Earnings before interest, tax, depreciation and amortisation, or EBITDA, increased 22.9% to Rs 41.9 crore from Rs 34.1 crore. Finance costs, however, rose to Rs 14.6 crore from Rs 6.9 crore, while tax was Rs 7.0 crore. The gap between operating-profit growth and final-profit growth defines Cellecor's H1 FY27 result.
Cellecor also reported more PAT than in H2 FY26, when PAT was Rs 12.6 crore. H1 FY27 PAT was 58.3% above that half-year figure, although it is not a year-on-year comparison: H2 FY26 included a tax charge of Rs 13.7 crore, compared with Rs 7.0 crore in H1 FY27.
How did Cellecor's margins change in H1 FY27?
Cellecor's gross and EBITDA margins improved modestly from H1 FY26, while PAT margin declined. Gross profit reached Rs 94.0 crore from Rs 79.3 crore, lifting gross margin to 12.5% from 12.4%. EBITDA margin rose to 5.6% from 5.3%, alongside EBITDA of Rs 41.9 crore.
The comparison with the immediately preceding H2 FY26 was different. Gross profit was 1.5% above H2 FY26's Rs 92.6 crore, but gross margin fell from 14.2% to 12.5%. EBITDA rose from Rs 37.1 crore in H2 FY26, while EBITDA margin edged down from 5.7% to 5.6%.
Cellecor's cost of goods sold represented Rs 656.3 crore of H1 FY27 income from operations of Rs 746.8 crore, compared with Rs 562.3 crore of Rs 641.5 crore in H1 FY26. The gross-profit increase of Rs 14.7 crore was therefore accompanied by a gross-margin improvement of only 0.1 percentage point year on year.
Cellecor's PAT margin was 2.7% in H1 FY27, compared with 3.1% in H1 FY26 and 1.9% in H2 FY26. The company retained a smaller share of sales than a year earlier despite the 16.4% sales increase, while retaining more than in the preceding half year. Basic earnings per share remained Rs 0.9 in both H1 FY27 and H1 FY26.
Got a follow-up? Ask IRIS
Which costs increased at Cellecor in H1 FY27?
Cellecor's largest disclosed cost line, cost of goods sold, increased to Rs 656.3 crore in H1 FY27 from Rs 562.3 crore in H1 FY26. Employee benefit expenses rose to Rs 13.3 crore from Rs 11.1 crore, while other expenses increased to Rs 38.8 crore from Rs 34.1 crore. Finance costs showed the largest disclosed increase, reaching Rs 14.6 crore from Rs 6.9 crore.
Against H2 FY26, cost of goods sold increased from Rs 557.7 crore to Rs 656.3 crore, while employee benefit expenses moved down from Rs 13.5 crore to Rs 13.3 crore. Other expenses declined from Rs 42.0 crore in H2 FY26 to Rs 38.8 crore in H1 FY27, but finance costs still rose from Rs 10.3 crore to Rs 14.6 crore.
Management attributed the profitability pressure to increased investment in offline and online marketing and to higher input costs across electronics. In its H1 FY27 director's message, management cited rupee depreciation against the US dollar, a shortage of memory chips, and higher plastic and metal prices as industry headwinds during the preceding nine months. The presentation does not separate marketing spending from other expenses.
Depreciation and amortisation fell to Rs 0.4 crore from Rs 0.5 crore, so that line did not account for the limited PAT growth. Other income rose to Rs 3.5 crore in H1 FY27 from Rs 0.1 crore a year earlier, bringing total income to Rs 750.3 crore. Despite that additional income, PAT increased by only Rs 0.3 crore year on year.
What is Cellecor doing to support growth after H1 FY27?
Cellecor is expanding product categories, distribution channels and brand activity, while management said it remains hopeful of a better second half. During H1 FY27, the company added garment steamers, steam irons, massage guns, tyre inflators and egg boilers. These categories complement its Smart TVs, washing machines, refrigerators, air conditioners and audio products.
Cellecor strengthened its presence in general trade, modern retail, e-commerce and direct-to-consumer, or D2C, platforms. Management also said it appointed Kriti Sanon as brand ambassador for its TV and washing-machine categories and released two television commercials, or TVCs, to improve visibility and recall. These measures form part of the marketing investment management linked to profitability pressure.
The company's Gali Gali Cellecor campaign targeted Tier 2, Tier 3 and emerging markets through mass media, digital activity, regional content, influencers and on-ground activations. Separately, management said it advanced plans for a large-scale manufacturing and assembly facility in Liberia, West Africa, to serve multiple African markets. The presentation does not provide an investment amount, start date or expected earnings contribution for that facility.
Conclusion
Cellecor's H1 FY27 results show sales and EBITDA growing faster than final profit: net sales increased by Rs 105.3 crore and EBITDA by Rs 7.8 crore year on year, while PAT rose by Rs 0.3 crore. Gross margin improved slightly from H1 FY26, but the increase in finance costs and management's stated marketing and input-cost pressures limited the conversion of revenue growth into net profit.
The next measure to watch is whether management's expectation of a better second half is reflected in margins and PAT as Cellecor continues its brand campaign and adds appliance categories. The planned Liberia manufacturing and assembly facility remains an unresolved item because the presentation does not disclose its investment amount, schedule or financial contribution, while finance costs of Rs 14.6 crore remain relevant to the earnings outcome.