










Cemindia FY26 profit reaches Rs 598 crore as returns rise
Key highlights
- Cemindia's FY26 PAT was Rs 598 crore, compared with Rs 69 crore in FY22.
- Cemindia reported FY26 revenue of Rs 10,061 crore and EBITDA of Rs 1,199 crore.
- Cemindia's FY26 ROCE was 33.5% and ROE was 28.2%.
- Cemindia's H1'FY27 net debt to trailing-12-month EBITDA was 0.61 times.
powered by IRIS
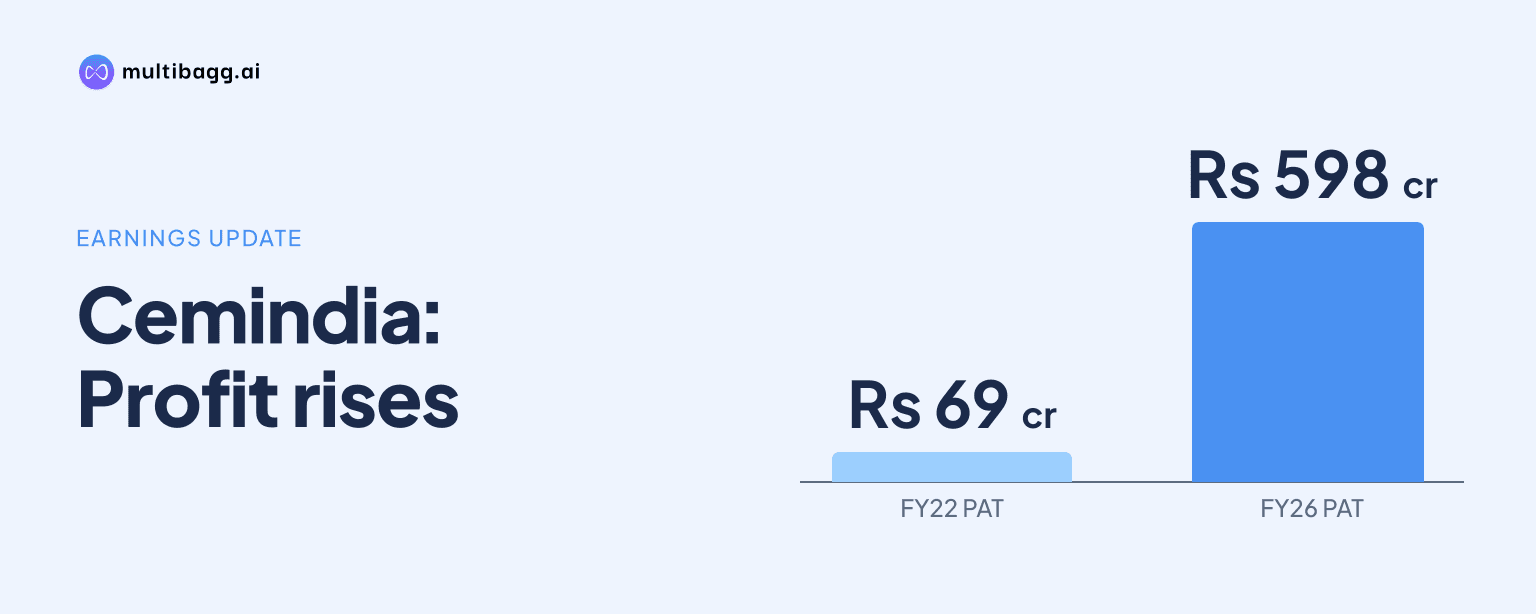
Cemindia reported profit after tax of Rs 598 crore in FY26, up from Rs 69 crore in FY22, as revenue reached Rs 10,061 crore and return on capital employed rose to 33.5%. Over the five-year period, its stated PAT compound annual growth rate of 72% exceeded revenue growth of 27%.
Know Cemindia Projects inside out
Results, valuation, peers and who's buying, in one view.
How did Cemindia's profit grow faster than revenue?
Cemindia's PAT rose by Rs 529 crore, from Rs 69 crore in FY22 to Rs 598 crore in FY26, while revenue increased by Rs 6,252 crore to Rs 10,061 crore from Rs 3,809 crore. The presentation reports a 72% compound annual growth rate, or CAGR, for PAT, compared with 27% for revenue over FY22 to FY26.
Earnings before interest, tax, depreciation and amortisation, or EBITDA, increased to Rs 1,199 crore in FY26 from Rs 338 crore in FY22. EBITDA's stated 37% CAGR was above revenue's 27% rate but below PAT's 72% rate, showing that reported earnings after tax increased faster than both sales and EBITDA over the period.
From FY25 to FY26, Cemindia's revenue grew by Rs 815 crore, EBITDA increased by Rs 260 crore and PAT rose by Rs 225 crore. The FY25 comparison is relevant because PAT's Rs 225 crore increase was close to the full FY22 PAT base of Rs 69 crore, despite revenue growth moderating from Rs 2,627 crore in FY24 to Rs 1,528 crore in FY25.
How did Cemindia's margins change through FY26?
Cemindia's EBITDA margin increased to 10.5% in FY26 from 8.8% in FY22, while PAT margin rose to 5.9% from 1.8%. The 4.1-percentage-point increase in PAT margin was greater than the 1.7-percentage-point increase in EBITDA margin over the same period.
The margin progression was not uniform in every year. EBITDA margin was 9.0% in FY23, reached 10.5% in FY24, and was 10.2% in FY25 before returning to 10.5% in FY26. PAT margin moved from 2.5% in FY23 to 3.5% in FY24, 4.0% in FY25 and 5.9% in FY26.
The presentation does not provide a separate breakdown of interest, depreciation or tax that explains the difference between EBITDA growth and PAT growth. It does, however, show PAT rising from Rs 373 crore in FY25 to Rs 598 crore in FY26, alongside EBITDA rising from Rs 939 crore to Rs 1,199 crore.
How much did Cemindia's return ratios improve?
Cemindia's return on capital employed, or ROCE, rose to 33.5% in FY26 from 13.5% in FY22, while return on equity, or ROE, increased to 28.2% from 6.3%. ROCE increased by 20.0 percentage points and ROE increased by 21.9 percentage points across the five fiscal years.
Both measures increased in each reported year. ROCE was 19.3% in FY23, 27.8% in FY24 and 28.5% in FY25, before reaching 33.5% in FY26. ROE rose from 10.5% in FY23 to 20.0% in FY24, 22.4% in FY25 and 28.2% in FY26.
The return-ratio improvement coincided with a Rs 861 crore increase in EBITDA between FY22 and FY26 and a Rs 529 crore increase in PAT. The presentation reports these ratios alongside the revenue expansion from Rs 3,809 crore to Rs 10,061 crore, but does not disclose the individual capital or equity balances used in the ratio calculations.
Got a follow-up? Ask IRIS
What credit ratings does Cemindia have?
Cemindia had an AA (Stable) rating from ICRA and Crisil by October 2026, while CareEdge rated it AA- (Stable). ICRA moved from A (Stable) in March 2019 and March 2025 to A+ (Stable) in March 2026, followed by AA (Stable) in October 2026.
CareEdge was rated A (Stable) in March 2019, A (Rating Watch with Positive implications) in March 2025, A+ (Stable) in March 2026 and AA- (Stable) in October 2026. Crisil assigned its first rating to Cemindia at AA (Stable), according to the presentation.
Management lists execution capabilities, a diversified order book, operating efficiency and prudent working capital among the rating highlights. The presentation also cites financial flexibility associated with being part of Adani growth, but it does not provide an agency forecast for revenue, profit or cash flow.
How has Cemindia's net debt to EBITDA changed?
Cemindia reported net debt of Rs 773 crore and net debt to EBITDA of 0.61 times in H1'FY27, based on trailing 12-month EBITDA of Rs 1,260 crore. The ratio was 0.44 times in FY26, when net debt was Rs 527 crore and EBITDA was Rs 1,199 crore.
Net debt increased by Rs 246 crore between FY26 and H1'FY27, and the ratio increased by 0.17 times. The H1'FY27 ratio was nevertheless below the 0.67 times reported in FY25, when net debt was Rs 628 crore and EBITDA was Rs 939 crore.
The historical series shows a ratio of 0.38 times in FY22, 0.60 times in FY23 and 0.31 times in FY24. Cemindia states that H1'FY27 EBITDA is calculated using trailing 12-month EBITDA, so the Rs 1,260 crore figure is not a standalone half-year EBITDA measure.
Conclusion
Cemindia's financial data show that PAT rose from Rs 69 crore in FY22 to Rs 598 crore in FY26, outpacing revenue growth from Rs 3,809 crore to Rs 10,061 crore. The increase in ROCE to 33.5% and ROE to 28.2%, together with ICRA's and Crisil's AA (Stable) ratings, marks the operating and credit-profile changes disclosed in the presentation.
The next disclosed measure to watch is net debt to EBITDA after the H1'FY27 reading of 0.61 times, compared with 0.44 times in FY26. Management also identifies its diversified order book as supporting medium-term revenue visibility, including Rs 2,577 crore in highways, bridges and flyovers, Rs 1,257 crore in foundation and specialist engineering, and Rs 480 crore in hydro dams, tunnels and irrigation.