










Cemindia Projects Q2 revenue rises 25% as PAT grows 21%
Key highlights
- Cemindia Projects reported Q2 FY27 revenue of ₹2,749 crore, up 25.2% year on year.
- Cemindia Projects’ Q2 FY27 PAT rose 21.3% year on year to ₹131 crore.
- Cemindia Projects’ EBITDA margin was 10.2% in Q2 FY27, compared with 11.1% in Q2 FY26.
- Cemindia Projects had an order book of ₹32,715 crore as of September 30, 2026.
powered by IRIS
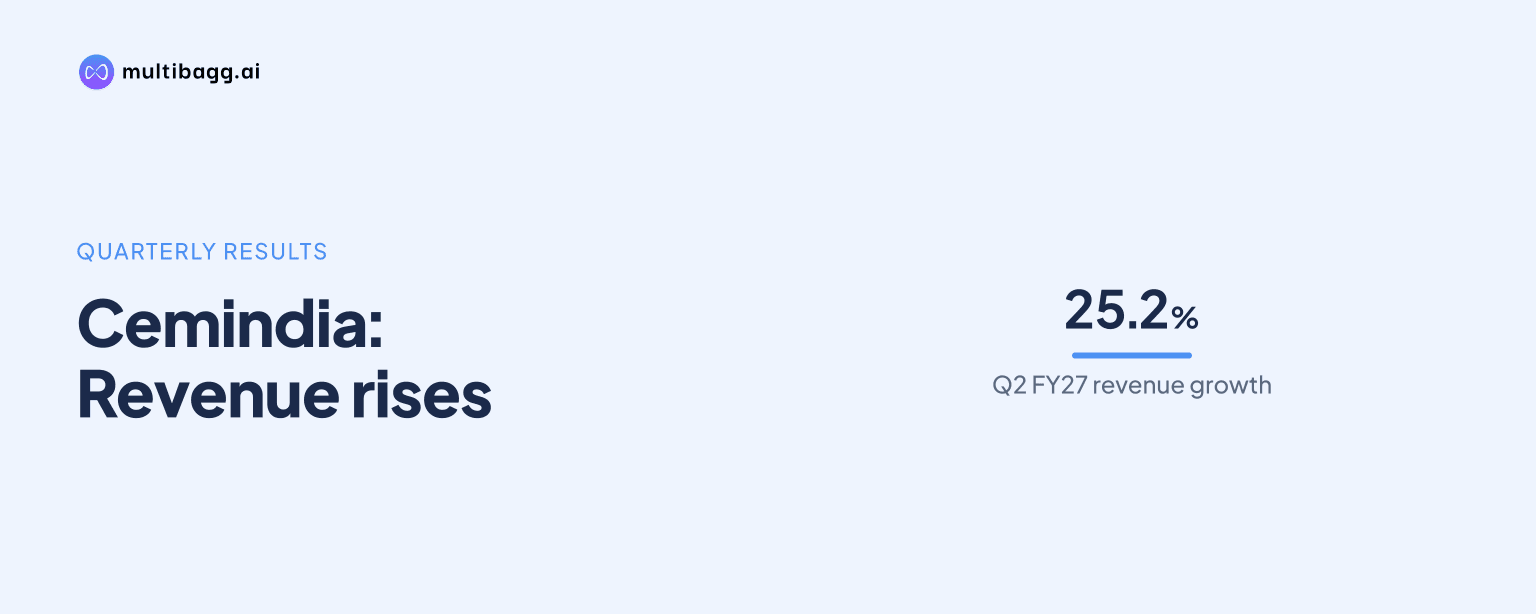
Cemindia Projects Limited reported consolidated revenue of ₹2,749 crore for Q2 FY27, up 25.2% year on year, while profit after tax rose 21.3% to ₹131 crore. Revenue grew faster than earnings before interest, tax, depreciation and amortisation, or EBITDA, reducing the EBITDA margin to 10.2% from 11.1% a year earlier.
Know Cemindia Projects inside out
Results, valuation, peers and who's buying, in one view.
How did Cemindia Projects perform in Q2 FY27?
Cemindia Projects increased consolidated revenue from operations to ₹2,748.65 crore in the quarter ended September 30, 2026, from ₹2,195.21 crore a year earlier. The company’s release rounded the figure to ₹2,749 crore and stated growth of 25.2% year on year. Total income, including other income, rose to ₹2,760.91 crore from ₹2,231.53 crore.
Profit after tax, or PAT, increased to ₹130.59 crore from ₹107.66 crore in Q2 FY26, while the release rounded the figures to ₹131 crore and ₹108 crore. Profit before tax rose to ₹179.89 crore from ₹146.40 crore. Basic and diluted earnings per share were ₹7.60, compared with ₹6.27 in the corresponding quarter of the preceding year.
Sequentially, revenue from operations was higher than ₹2,720.92 crore reported for the quarter ended June 30, 2026. PAT was lower than ₹140.83 crore in the preceding quarter, and profit before tax declined from ₹192.37 crore. Tax expense was ₹49.30 crore in Q2 FY27, compared with ₹54.53 crore in Q1 FY27 and ₹38.74 crore in Q2 FY26.
Why did Cemindia Projects’ margins narrow despite revenue growth?
Cemindia Projects’ EBITDA rose 15.1% to ₹280 crore in Q2 FY27 from ₹243 crore in Q2 FY26, but that increase was below the 25.2% revenue growth rate. EBITDA margin consequently declined by 0.9 percentage points to 10.2% from 11.1%. PAT margin declined by 0.1 percentage points to 4.8% from 4.9%.
The consolidated statement recorded construction-material consumption of ₹957.02 crore in Q2 FY27, against ₹718.96 crore a year earlier. Subcontracting expenses increased to ₹1,077.15 crore from ₹876.11 crore, while other direct costs rose to ₹272.61 crore from ₹207.25 crore. These three cost lines increased alongside the expansion in quarterly revenue.
For the six months ended September 30, 2026, EBITDA was ₹565 crore, up 12.1% from ₹504 crore in H1 FY26. H1 EBITDA margin was 10.3%, compared with 10.6% a year earlier. PAT rose 10.8% to ₹271 crore from ₹245 crore, while PAT margin moved to 5.0% from 5.1%.
What does Cemindia Projects’ order book show about future work?
Cemindia Projects had a record order book of ₹32,715 crore as of September 30, 2026. It secured new orders worth about ₹3,485 crore in Q2 FY27, taking total order inflow for H1 FY27 to about ₹12,005 crore. Managing Director Jayanta Basu said the order book provides multi-year revenue visibility.
Maritime Structures was the largest disclosed order-book category at 23.0%. Urban Infrastructure, Mass Rapid Transit Systems and Airports accounted for 19.7%, followed by Industrial Structures and Buildings at 18.8% and Data Centres at 15.0%. Water and Wastewater represented 10.3%, while Highways, Bridges and Flyovers accounted for 7.9%.
Foundation and Specialist Engineering represented 3.8% of the order book, and Hydro, Dams, Tunnels and Irrigation accounted for 1.5%. Cemindia Projects reports one business segment, Engineering and Construction, with operations mainly in India. The order-book figures therefore describe project-category exposure rather than separately reported financial segments.
Got a follow-up? Ask IRIS
How did Cemindia Projects’ balance sheet and cash flow change?
Cemindia Projects reported consolidated net worth of ₹2,619 crore and net debt of ₹773 crore as of September 30, 2026, equivalent to a net debt-to-equity ratio of 0.30 times. Total equity was ₹2,619.40 crore, up from ₹2,399.59 crore at March 31, 2026. Total assets increased to ₹7,562.72 crore from ₹7,086.45 crore.
Working-capital balances rose over the six months. Contract assets increased to ₹2,737.78 crore from ₹2,263.49 crore, trade receivables rose to ₹1,443.60 crore from ₹1,294.56 crore, and inventories reached ₹837.92 crore from ₹750.92 crore. Contract liabilities also increased to ₹1,249.87 crore from ₹1,023.75 crore.
Net cash used in operating activities was ₹77.65 crore in H1 FY27, compared with net cash generated from operating activities of ₹328.25 crore in H1 FY26. The cash-flow statement included a ₹499 crore increase in contract assets and a ₹154.67 crore increase in trade receivables in H1 FY27. Cash and cash equivalents ended September 2026 at ₹240.33 crore, compared with ₹474.69 crore at the beginning of the period.
What did Cemindia Projects raise through its October QIP?
Cemindia Projects raised ₹1,400 crore through a Qualified Institutional Placement, or QIP, in October 2026, after the September quarter ended. On October 19, 2026, the management committee approved the allotment of 1,26,35,379 equity shares with a face value of ₹1 each at an issue price of ₹108 per share.
The allotment increased paid-up equity share capital to ₹18.44 crore from ₹17.18 crore. Cemindia Projects said net QIP proceeds will be used for capital expenditure, repayment or prepayment of borrowings, working-capital requirements and general corporate purposes. Incremental costs directly attributable to the equity transaction will be adjusted against the securities premium account.
ICRA upgraded its long-term rating to AA with a stable outlook from A+ stable, while CARE upgraded its rating to AA- stable from A+ stable. Crisil assigned a AA stable long-term rating. The disclosed short-term rating from each of Crisil, ICRA and CARE was A1+.
Conclusion
Cemindia Projects delivered higher Q2 FY27 revenue, EBITDA and PAT, but revenue expanded faster than EBITDA, resulting in lower EBITDA and PAT margins than in Q2 FY26. Its ₹32,715 crore order book spans maritime structures, urban infrastructure, industrial structures, data centres and other engineering categories.
The next disclosed items to watch are the conversion of approximately ₹12,005 crore of H1 FY27 order inflow into revenue, changes in the 10.2% Q2 EBITDA margin, and deployment of the ₹1,400 crore October 2026 QIP proceeds for capital expenditure, borrowings, working capital and general corporate purposes.