










Chandan FY26 fixed assets reach ₹144.22 crore, cover falls
Key highlights
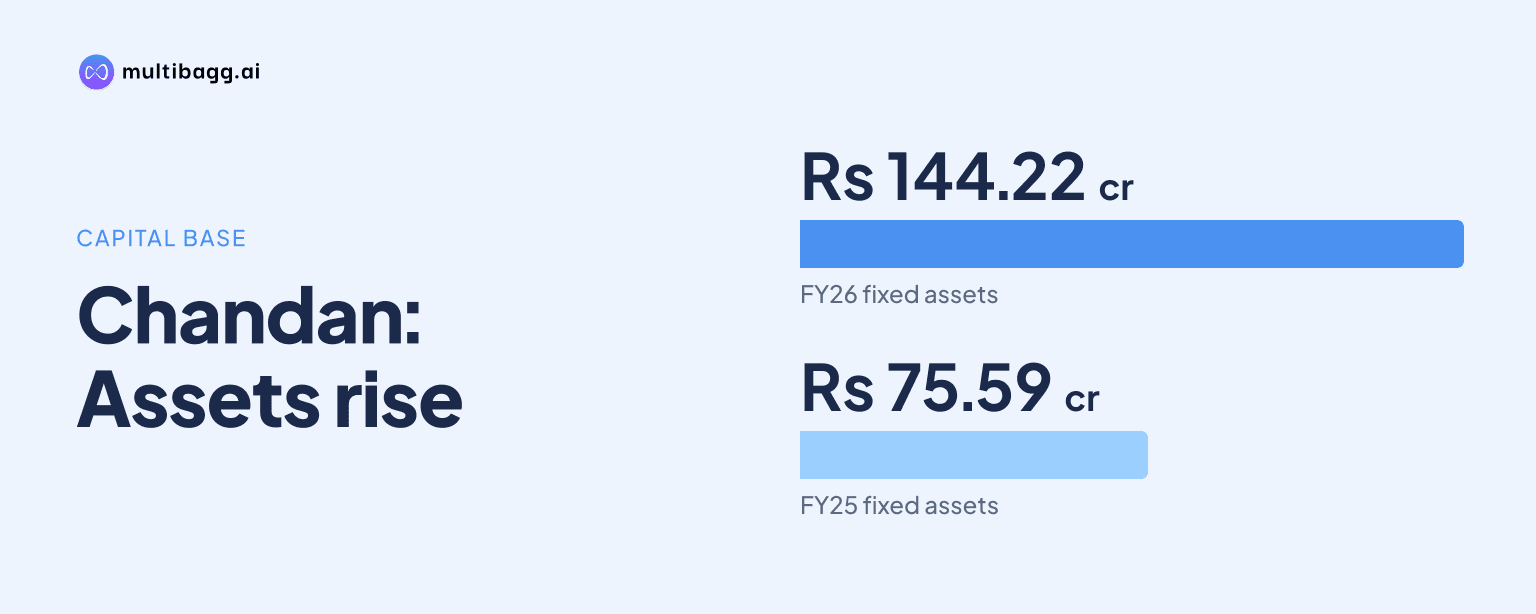
- Chandan’s fixed assets increased to ₹144.22 crore in FY26 from ₹75.59 crore in FY25.
- Chandan’s interest coverage declined to 3.39 times in FY26 from 8.89 times in FY25.
- Chandan generated operating cash flow of ₹72.83 crore in FY26 after an ₹18.69 crore outflow in FY25.
- Chandan’s investing cash outflow reached ₹90.69 crore in FY26, compared with ₹35.80 crore in FY25.
powered by IRIS
Chandan Healthcare Limited reported fixed assets of ₹144.22 crore in FY26, while interest coverage fell to 3.39 times from 8.89 times in FY25 as finance costs rose to ₹11.86 crore and investing cash outflow reached ₹90.69 crore during the financial year, according to its presentation.
Know Chandan Healthcare inside out
Results, valuation, peers and who's buying, in one view.
How much did Chandan’s fixed-asset base grow in FY26?
Chandan’s fixed assets increased to ₹144.22 crore in FY26 from ₹75.59 crore in FY25, a year-on-year addition of ₹68.63 crore. The FY26 fixed-asset balance was also ₹100.69 crore above the ₹43.53 crore recorded in FY24, showing that the asset base expanded substantially across the two-year period.
Total non-current assets rose to ₹165.53 crore in FY26 from ₹103.80 crore in FY25, while total assets increased to ₹268.76 crore from ₹176.90 crore. Fixed assets were the largest component of non-current assets in FY26, compared with non-current investments of ₹17.79 crore, other non-current financial assets of ₹1 crore and other non-current assets of ₹2.52 crore.
Current assets increased to ₹103.23 crore in FY26 from ₹73.11 crore in FY25, although individual balances moved differently. Trade receivables rose to ₹44.19 crore from ₹31.31 crore and other current financial assets increased to ₹32.89 crore from ₹13.55 crore, while cash and bank balances declined to ₹3.14 crore from ₹6.03 crore and inventories fell to ₹16.23 crore from ₹17.12 crore.
What do Chandan’s FY26 cash flows show about expansion funding?
Chandan reported cash outflow from investing activities of ₹90.69 crore in FY26, compared with outflows of ₹35.80 crore in FY25 and ₹15.36 crore in FY24. The FY26 investing outflow was ₹54.89 crore higher than the prior year and occurred alongside the ₹68.63 crore increase in fixed assets.
Cash flow from operating activities was an inflow of ₹72.83 crore in FY26, reversing an outflow of ₹18.69 crore in FY25. Financing activities provided ₹14.96 crore in FY26, lower than the ₹59.99 crore inflow in FY25, and the combined cash movements resulted in a net decrease in cash and cash equivalents of ₹2.90 crore.
Management disclosed residual capital expenditure of approximately ₹10 crore for FY27, which it plans to fund from internal accruals. The presentation says eight Comprehensive Diagnostic Centres were nearing completion, more than six diagnostic centres offering laboratory and radiology services were under development, and the expansion programme was targeted for completion before December 2026.
Got a follow-up? Ask IRIS
Why did Chandan’s interest coverage decline to 3.39 times?
Chandan’s reported interest coverage declined to 3.39 times in FY26 from 8.89 times in FY25 and 10.92 times in FY24. The decline coincided with finance costs rising to ₹11.86 crore in FY26 from ₹3.57 crore in FY25 and ₹2.11 crore in FY24.
Earnings before interest, tax, depreciation and amortisation, or EBITDA, increased to ₹54.01 crore in FY26 from ₹38.16 crore in FY25. However, depreciation also rose to ₹13.78 crore from ₹6.42 crore, while profit before tax was ₹28.38 crore, only marginally above ₹28.17 crore in FY25 despite the ₹15.85 crore increase in EBITDA.
Chandan’s EBITDA margin increased to 33.58% in FY26 from 29.08% in FY25, while profit after tax declined to ₹19.82 crore from ₹20.78 crore. Profit after tax margin fell to 12.32% from 15.84%, and the presentation reported FY26 total income of ₹160.86 crore.
The presentation contains two FY25 total-income figures. The standalone profit and loss statement lists FY25 total income of ₹130.47 crore, whereas the key financial highlights page lists ₹131.21 crore; both pages show FY26 total income of ₹160.86 crore.
How did Chandan’s capital structure change in FY26?
Chandan’s total equity increased to ₹162.77 crore in FY26 from ₹120.72 crore in FY25, with reserves and surplus rising to ₹138.31 crore from ₹96.26 crore. Its reported debt-to-equity ratio declined to 0.24 times from 0.28 times in FY25 and 0.72 times in FY24, even as interest coverage moved lower.
Long-term borrowings increased to ₹28.58 crore in FY26 from ₹22.14 crore in FY25, while short-term borrowings fell to ₹10.05 crore from ₹11.06 crore. Total non-current liabilities rose to ₹35.09 crore from ₹27.20 crore, and current liabilities increased to ₹70.90 crore from ₹28.98 crore.
Other current liabilities accounted for much of the movement in current liabilities, rising to ₹49.82 crore in FY26 from ₹6.93 crore in FY25. Trade payables were ₹10.07 crore, slightly below ₹10.34 crore a year earlier, while short-term provisions rose to ₹0.96 crore from ₹0.65 crore.
Reported return and per-share measures declined in some areas as the balance sheet expanded. Return on equity was 12.18% in FY26 versus 17.21% in FY25, return on capital employed was 19.98% versus 20.62%, and earnings per share were ₹7.89 versus ₹10.10; book value per share increased to ₹66.57 from ₹49.37.
Conclusion
Chandan’s FY26 statements show the financial effects of a larger diagnostic asset base: fixed assets reached ₹144.22 crore, operating cash flow recovered to ₹72.83 crore and investing cash outflow reached ₹90.69 crore. At the same time, finance costs increased to ₹11.86 crore, interest coverage declined to 3.39 times and profit after tax fell to ₹19.82 crore despite higher EBITDA.
The next disclosed milestones are management’s plan to commission centres progressively during FY27 and complete the expansion programme before December 2026. Management has identified approximately ₹10 crore of residual capital expenditure to be funded from internal accruals, alongside planned Comprehensive Diagnostic Centres, standalone laboratories, a genome sequencing laboratory in Jankipuram, Lucknow, and PET-CT centres in Kanpur and Gorakhpur.