










Chandan FY26 fixed assets hit ₹144.22 crore; coverage fell
Key highlights
- Chandan’s fixed assets increased to ₹144.22 crore in FY26 from ₹75.59 crore in FY25.
- FY26 investing cash outflow was ₹90.69 crore, compared with ₹35.80 crore in FY25.
- Chandan’s EBITDA rose to ₹54.01 crore in FY26 and its EBITDA margin reached 33.58%.
- Interest coverage fell to 3.39 times in FY26 from 8.89 times in FY25 as finance costs reached ₹11.86 crore.
powered by IRIS
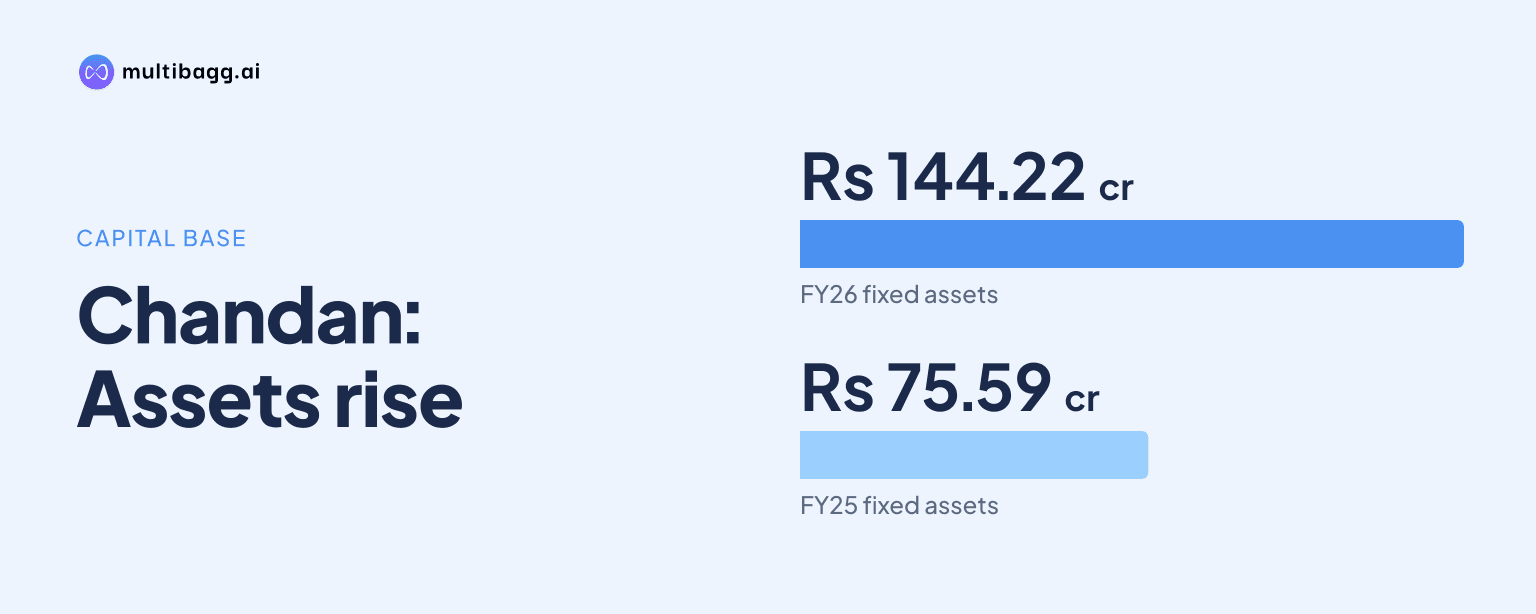
Chandan Healthcare Limited’s FY26 infrastructure build-out lifted fixed assets to ₹144.22 crore from ₹75.59 crore in FY25, while interest coverage fell to 3.39 times from 8.89 times as finance costs reached ₹11.86 crore. The figures pair a ₹90.69 crore investing outflow with ₹72.83 crore of operating cash flow.
Know Chandan Healthcare inside out
Results, valuation, peers and who's buying, in one view.
How much did Chandan invest in infrastructure in FY26?
Chandan expanded fixed assets by ₹68.63 crore in FY26, taking the balance from ₹75.59 crore in FY25 to ₹144.22 crore. Fixed assets had already increased by ₹32.06 crore from ₹43.53 crore in FY24, making the FY26 increase more than twice the increase recorded in the preceding year. Total non-current assets rose to ₹165.53 crore in FY26 from ₹103.80 crore in FY25.
The cash-flow statement records ₹90.69 crore of net cash used in investing activities in FY26, compared with ₹35.80 crore in FY25 and ₹15.36 crore in FY24. That investing outflow exceeded FY26 EBITDA, or earnings before interest, tax, depreciation and amortisation, of ₹54.01 crore. The presentation does not break the investing line into individual equipment, laboratory or centre-level purchases.
What changed in Chandan’s operating earnings during FY26?
Chandan’s EBITDA increased to ₹54.01 crore in FY26 from ₹38.16 crore in FY25, while the EBITDA margin rose to 33.58% from 29.08%. Revenue increased to ₹156.65 crore from ₹129.16 crore in the standalone profit and loss statement, while raw-material expense increased to ₹28.98 crore from ₹19.70 crore. Employee cost also rose to ₹44.13 crore from ₹33.39 crore.
Total income was ₹160.86 crore in FY26, compared with ₹130.47 crore in FY25 in the standalone profit and loss statement, with other income rising to ₹4.21 crore from ₹1.31 crore. The financial-highlights page separately states FY25 total income of ₹131.21 crore rather than ₹130.47 crore. Both presentation pages report FY26 total income of ₹160.86 crore.
Cash flow from operating activities was ₹72.83 crore in FY26, following an outflow of ₹18.69 crore in FY25 and an inflow of ₹5.85 crore in FY24. The presentation reports the cash-flow categories but does not provide a working-capital bridge explaining the movement between FY25 and FY26.
Why did Chandan’s interest coverage fall to 3.39 times?
Chandan’s reported interest coverage fell to 3.39 times in FY26 from 8.89 times in FY25 and 10.92 times in FY24, while finance costs increased to ₹11.86 crore from ₹3.57 crore. The fall occurred in the same year that depreciation rose to ₹13.78 crore from ₹6.42 crore and fixed assets reached ₹144.22 crore.
Profit before tax was broadly unchanged at ₹28.38 crore in FY26 versus ₹28.17 crore in FY25, despite EBITDA increasing by ₹15.85 crore. Profit after tax declined to ₹19.82 crore from ₹20.78 crore, and the profit-after-tax margin decreased to 12.32% from 15.84%. The reported figures show that higher FY26 operating profit did not result in a higher profit after tax.
Got a follow-up? Ask IRIS
How did Chandan fund its FY26 asset expansion?
Chandan reported a ₹14.96 crore cash inflow from financing activities in FY26, lower than ₹59.99 crore in FY25, while operating activities generated ₹72.83 crore. Investing activities used ₹90.69 crore, producing a ₹2.90 crore net decrease in cash and cash equivalents after a ₹5.50 crore increase in FY25. Cash and bank balance ended FY26 at ₹3.14 crore, compared with ₹6.03 crore a year earlier.
On the balance sheet, long-term borrowings increased to ₹28.58 crore in FY26 from ₹22.14 crore in FY25, while short-term borrowings declined to ₹10.05 crore from ₹11.06 crore. Other current liabilities rose to ₹49.82 crore from ₹6.93 crore, taking total current liabilities to ₹70.90 crore from ₹28.98 crore. The presentation does not specify the components behind the ₹42.89 crore increase in other current liabilities.
Total equity rose to ₹162.77 crore in FY26 from ₹120.72 crore in FY25, driven by reserves and surplus of ₹138.31 crore versus ₹96.26 crore. Total assets increased to ₹268.76 crore from ₹176.90 crore. The debt-to-equity ratio declined to 0.24 times from 0.28 times, even as finance costs and long-term borrowings increased.
What does Chandan plan to complete after FY26?
Chandan plans to complete an expansion programme before December 2026 with residual capital expenditure of approximately ₹10 crore funded from internal accruals. Management says eight Comprehensive Diagnostic Centres were nearing completion and would be commissioned progressively in the coming months, while more than six diagnostic centres offering laboratory and radiology services were under development.
For FY27, management plans four to five Comprehensive Diagnostic Centres and 10 to 12 standalone laboratories, a genome sequencing laboratory in Jankipuram, Lucknow, and two PET-CT centres in Kanpur and Gorakhpur. The plan also includes commissioning radiology centres in Punjab and Guwahati. These are management’s stated plans rather than reported FY26 operating results.
Over the next two years, management targets 1,000 franchise centres by the end of FY27 and 3,000 centres thereafter, alongside a laboratory in every district of Uttar Pradesh and Uttarakhand. The medium-term roadmap lists 40 Comprehensive Diagnostic Centres, 50 Diagnostic Centres, more than 100 Chandann Medical Centres and expansion across 18 states. The presentation gives targets but no projected revenue, EBITDA, borrowing or interest-cost figures for those plans.
Conclusion
Chandan’s FY26 accounts show a substantial increase in its asset base: fixed assets rose by ₹68.63 crore, investing cash outflow reached ₹90.69 crore, and operating cash flow improved to ₹72.83 crore. EBITDA rose to ₹54.01 crore and its margin reached 33.58%, but finance costs increased to ₹11.86 crore, profit after tax fell to ₹19.82 crore and interest coverage declined to 3.39 times.
The next disclosed milestone is completion of the residual approximately ₹10 crore expansion programme before December 2026. Investors can watch the progressive commissioning of eight near-complete Comprehensive Diagnostic Centres, the planned PET-CT and genome facilities, and whether future cash flow, finance costs and interest coverage reflect the capacity additions.