










Chemplast Sanmar Limited Reports ₹1,323 Crore Q2 Revenue
Key highlights
- Chemplast Sanmar Limited's Q2 FY27 revenue rose 28.1% year on year to ₹1,323.21 crore.
- Q2 FY27 EBITDA was ₹111 crore with an 8% margin, compared with ₹43 crore and a 4% margin in Q2 FY26.
- Chemplast Sanmar Limited's Q2 FY27 net loss narrowed to ₹5.45 crore from ₹51.04 crore a year earlier.
- H1 FY27 revenue was ₹2,447.87 crore, while the company recorded an EBITDA loss of ₹115 crore and net loss of ₹181.03 crore.
powered by IRIS
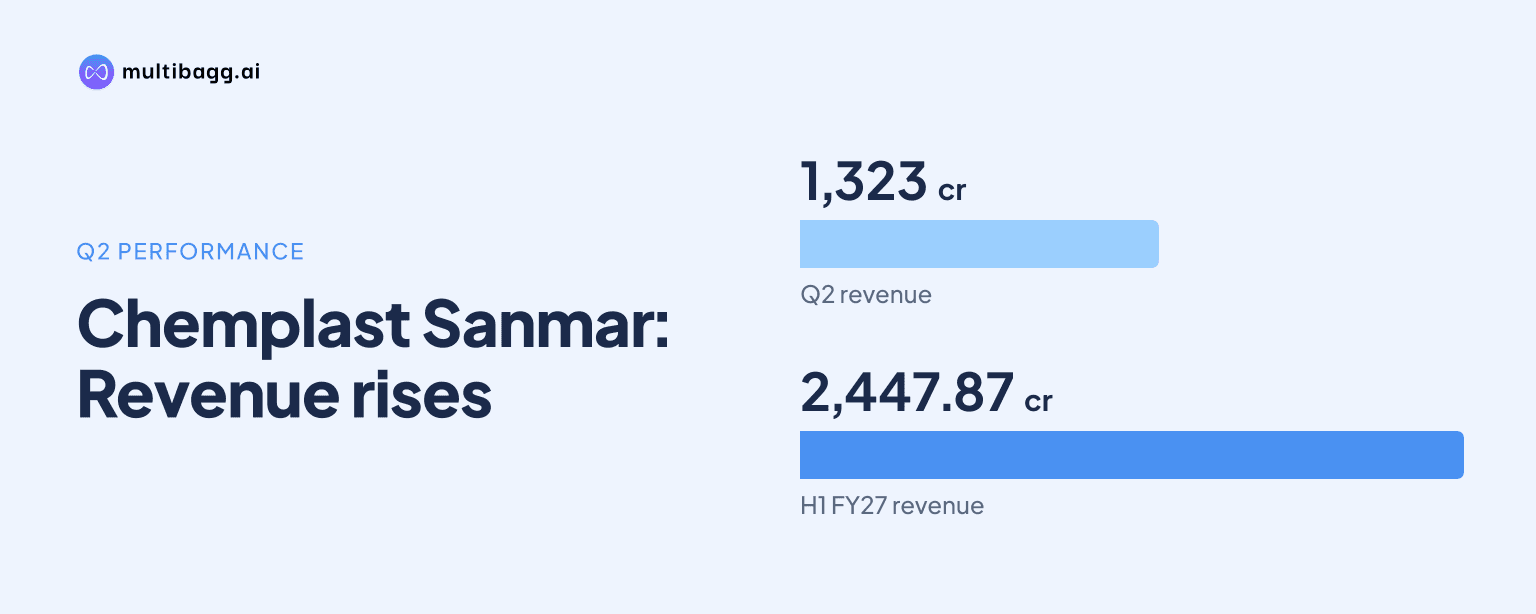
Chemplast Sanmar Limited reported Q2 FY27 consolidated revenue of ₹1,323 crore, up 28.1% year on year, while its net loss narrowed to ₹5.5 crore and EBITDA improved to ₹111 crore. The quarterly improvement reflects better performance in paste PVC, CMCD and suspension PVC, although weak commodity PVC and VAC conditions continued to weigh on profitability.
Know Chemplast Sanmar inside out
Results, valuation, peers and who's buying, in one view.
What did Chemplast Sanmar report for Q2 FY27?
Chemplast Sanmar reported a substantial improvement in quarterly operating performance for the quarter ended September 30, 2026. Consolidated revenue from operations rose to ₹1,323.21 crore, compared with a year-earlier level implied by the reported 28.1% growth. EBITDA was ₹111 crore, against ₹43 crore in Q2 FY26, and the EBITDA margin expanded to 8% from 4% a year earlier.
The company remained loss-making at the net level, but the deficit narrowed sharply. The reported Q2 FY27 net loss was ₹5.45 crore, compared with a loss of ₹51.04 crore in Q2 FY26. Management’s earnings-call summary referred to a net loss of about ₹5 crore, consistent with rounding of the reported quarterly figure.
The sequential change was also material. Chemplast Sanmar had recorded an EBITDA loss of ₹115 crore in Q1 FY27, making the ₹111 crore EBITDA reported in Q2 a recovery in operating profitability. The call summary attributed the improvement to stronger paste PVC demand and pricing, sustained CMCD performance, and higher suspension PVC revenue.
Which businesses supported Chemplast Sanmar's quarterly recovery?
Paste PVC demand and pricing, CMCD performance, and improved suspension PVC revenue supported Chemplast Sanmar's Q2 FY27 recovery. These factors helped lift revenue and EBITDA even as conditions in some commodity-linked businesses remained difficult.
Management said specialty segments were improving, indicating a better operating backdrop in these businesses during the quarter. CMCD was specifically identified as having maintained its performance. The call summary also cited stronger paste PVC demand and pricing as a contributor to the improvement from the preceding quarter.
However, the company continued to face pressure in value-added chemicals and commodity spreads. Commodity PVC and VAC were described as weak in the investor presentation summary. This explains why the improvement in operating earnings did not translate into a positive quarterly net profit.
The gap between an 8% EBITDA margin and a net loss also underlines the limited nature of the recovery. The quarter showed a return to positive EBITDA after Q1, but profitability remained sensitive to product mix, prices and spreads in the company’s commodity-linked operations.
Got a follow-up? Ask IRIS
How did the first half of FY27 compare with the quarter?
Chemplast Sanmar's H1 FY27 results remained weak despite the better second quarter, with a net loss of ₹181.03 crore and an EBITDA loss of ₹115 crore. The quarterly recovery therefore partly offset, but did not erase, the losses recorded in the first quarter.
Consolidated H1 FY27 revenue was ₹2,447.87 crore, up 15% year on year. The half-year figures show that sales growth did not by itself restore profitability during the first six months, as the company continued to report negative EBITDA and a larger net loss for the period.
The contrast between the two periods is important for investors assessing the results. Q2 generated ₹111 crore of EBITDA after an EBITDA loss of ₹115 crore in Q1, but the H1 aggregate still reflected the earlier operating weakness. The company did not provide a full half-year segment-wise financial breakdown in the supplied material.
What do PVC demand and commodity conditions mean for investors?
PVC demand offered a supportive backdrop, but weak commodity PVC and VAC conditions remained the central constraint on Chemplast Sanmar's profitability. Management cited Indian suspension PVC demand of 4.2 million tons against domestic capacity of 1.5 million tons and said it sees demand broadly tracking GDP growth.
The demand-capacity figures point to a sizeable gap between cited domestic demand and installed capacity in suspension PVC. But the company’s Q2 commentary also makes clear that demand growth alone does not determine earnings. Commodity spreads, pricing and performance in value-added chemicals affected the reported result alongside volumes.
For investors, the principal financial change was the move from a Q1 EBITDA loss to positive Q2 EBITDA. Revenue growth of 28.1% year on year and the increase in EBITDA margin to 8% provide evidence of improved operations, while the quarterly net loss and H1 loss show that the recovery had not yet fully repaired the balance of the year.
No share-price movement, guidance revision or capital-allocation announcement was included in the supplied material. The disclosed results instead focus attention on whether specialty-segment improvement and PVC demand can continue while commodity PVC, VAC and value-added chemical pressures persist.
Conclusion
Chemplast Sanmar's Q2 FY27 performance was materially better than both Q2 FY26 and Q1 FY27 on the disclosed operating measures. Revenue reached ₹1,323.21 crore, EBITDA rose to ₹111 crore and the net loss narrowed to ₹5.45 crore, helped by paste PVC, CMCD and suspension PVC. Yet the company remained loss-making, and H1 FY27 closed with an EBITDA loss of ₹115 crore and a net loss of ₹181.03 crore.
The next area to watch is whether the Q2 improvement can be maintained against weak commodity PVC and VAC conditions and pressure in value-added chemicals. Management has linked suspension PVC demand broadly to GDP growth and highlighted a 4.2 million-ton demand market against 1.5 million tons of capacity, making demand, pricing and commodity spreads key indicators for subsequent results.