










Chemplast Sanmar revenue fell 28% as net debt hit Rs 1,419 crore
Key highlights
- Chemplast Sanmar’s FY26 consolidated revenue was Rs 4,224 crore, down from Rs 5,892 crore in FY22.
- EBITDA margin declined from 20% in FY22 to 5% in FY26, after reaching 1% in FY24.
- Net debt reached Rs 1,419 crore in FY26, compared with a Rs 362 crore net-cash position in FY22.
- Specialty Chemicals revenue increased to Rs 1,537 crore in FY26 from Rs 1,310 crore in FY22.
powered by IRIS
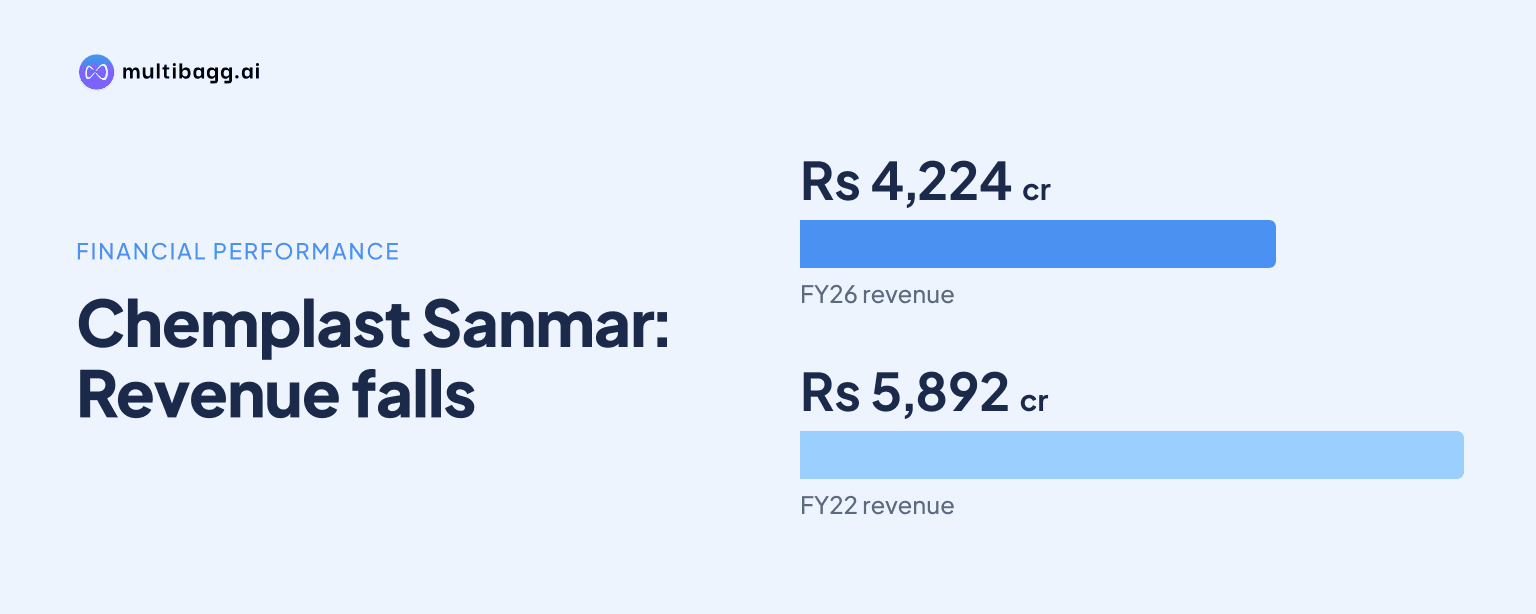
Chemplast Sanmar Ltd.’s consolidated revenue declined 28% to Rs 4,224 crore in FY26 from Rs 5,892 crore in FY22, while EBITDA margin fell to 5% from 20% and net debt reached Rs 1,419 crore, compared with a Rs 362 crore net-cash position at the FY22 end. Chemplast Sanmar reported all figures on a consolidated basis.
Know Chemplast Sanmar inside out
Results, valuation, peers and who's buying, in one view.
How did Chemplast Sanmar’s revenue change over five years?
Chemplast Sanmar’s revenue fell by Rs 1,668 crore between FY22 and FY26, with the low point occurring in FY24 at Rs 3,923 crore. Revenue recovered by Rs 423 crore in FY25 to Rs 4,346 crore, but then declined by Rs 122 crore in FY26. The FY26 total therefore remained Rs 1,668 crore below the FY22 level.
The annual sequence shows a Rs 951 crore reduction in FY23 from FY22, followed by a further Rs 1,018 crore reduction in FY24. The subsequent FY25 increase did not restore FY22 revenue, and FY26 revenue was lower than FY25 despite a higher total sales volume. The presentation identifies these figures as consolidated.
Total sales volume increased from 511,761 metric tons, or mt, in FY22 to 568,946 mt in FY26, a gain of 57,185 mt. Volume was 552,219 mt in FY23, 538,545 mt in FY24 and 566,556 mt in FY25. The revenue decline alongside higher FY26 volume shows that aggregate sales quantity and reported revenue followed different five-year paths; the presentation does not state the reason.
Which Chemplast Sanmar segments changed most between FY22 and FY26?
Suspension polyvinyl chloride, or PVC, recorded the largest absolute revenue reduction, falling Rs 1,697 crore to Rs 2,186 crore in FY26 from Rs 3,883 crore in FY22. This reduction was larger than the company-wide revenue decline of Rs 1,668 crore because Specialty Chemicals increased over the same period. Suspension PVC nevertheless remained Chemplast Sanmar’s largest reported revenue segment in FY26.
Specialty Chemicals rose by Rs 227 crore over the five years, reaching Rs 1,537 crore in FY26 after recording Rs 980 crore in FY24. The presentation defines the segment as Paste PVC, the Custom Manufactured Chemicals Division and refrigerant gas. Its sales volume rose from 66,576 mt in FY22 to 114,651 mt in FY26, an increase of 48,075 mt.
Value-added Chemicals declined by Rs 199 crore from Rs 700 crore in FY22 to Rs 501 crore in FY26. The segment includes caustic soda, chloromethanes and hydrogen peroxide. Its volume declined from 145,917 mt to 134,587 mt over the period, while Suspension PVC volume increased from 299,268 mt to 319,708 mt even as its revenue declined.
The segmental revenue total excludes inter-company sales between CSL and CCVL, according to the presentation. The three reported segments add to the total of Rs 4,224 crore in FY26, as they did in FY22 at Rs 5,892 crore. The presentation does not provide separate revenue figures for CSL and CCVL in these tables.
Got a follow-up? Ask IRIS
What happened to Chemplast Sanmar’s profit and debt position?
Chemplast Sanmar’s EBITDA, or earnings before interest, tax, depreciation and amortisation, fell to Rs 198 crore in FY26 from Rs 1,197 crore in FY22, while its EBITDA margin declined by 15 percentage points to 5% from 20%. EBITDA fell as low as Rs 26 crore in FY24, when the margin was 1%, before recovering to Rs 219 crore and a 5% margin in FY25.
The FY26 EBITDA figure was Rs 21 crore lower than FY25, while the EBITDA margin was unchanged at 5%. This followed an FY25 increase of Rs 193 crore from the FY24 EBITDA of Rs 26 crore. The recovery from FY24 therefore did not return EBITDA or margin to FY22 levels.
Profit after tax, or PAT, moved from a profit of Rs 649 crore in FY22 to a loss of Rs 280 crore in FY26. Chemplast Sanmar reported PAT of Rs 152 crore in FY23, followed by losses of Rs 158 crore in FY24 and Rs 110 crore in FY25. The FY26 loss was Rs 170 crore greater than the FY25 loss.
Net debt changed from negative Rs 362 crore in FY22 to Rs 1,419 crore in FY26. The negative FY22 net-debt figure represented a net-cash position; by FY24, net debt was Rs 741 crore. It then increased by Rs 376 crore to Rs 1,117 crore in FY25 and by a further Rs 302 crore in FY26.
Chemplast Sanmar’s net debt rose by Rs 1,781 crore between FY22 and FY26 when measured from the Rs 362 crore FY22 net-cash position. The presentation provides the annual net-debt totals but does not provide a debt maturity schedule, interest cost, cash balance or a stated explanation for the movement. Those omissions limit conclusions from the five annual net-debt figures alone.
Conclusion
Chemplast Sanmar’s FY22-to-FY26 record combines lower consolidated revenue, a substantial reduction in EBITDA and a move from net cash to Rs 1,419 crore of net debt. Revenue declined by Rs 1,668 crore despite total sales volume increasing by 57,185 mt, as Suspension PVC revenue fell by Rs 1,697 crore while Specialty Chemicals revenue increased by Rs 227 crore.
The presentation does not disclose a forward plan, target or scheduled event after FY26. The next reported figures to watch are whether EBITDA moves above Rs 198 crore and a 5% margin, and whether net debt changes from the FY26 total of Rs 1,419 crore as segment revenue evolves from the FY26 levels of Rs 2,186 crore for Suspension PVC, Rs 1,537 crore for Specialty Chemicals and Rs 501 crore for Value-added Chemicals.