










Chtrbox expands H1FY27 scale; top 10 clients supplied 41.8%
Key highlights
- Chtrbox engaged 436 creators in H1FY27, up from 324 in H1FY26.
- Chtrbox executed 1,437 campaigns in H1FY27, compared with 1,293 a year earlier.
- Chtrbox served 528 brands in H1FY27, up 70 from 458 in H1FY26.
- Chtrbox's top 10 clients supplied 41.8% of H1FY27 business, versus 42.5% in H1FY26.
powered by IRIS
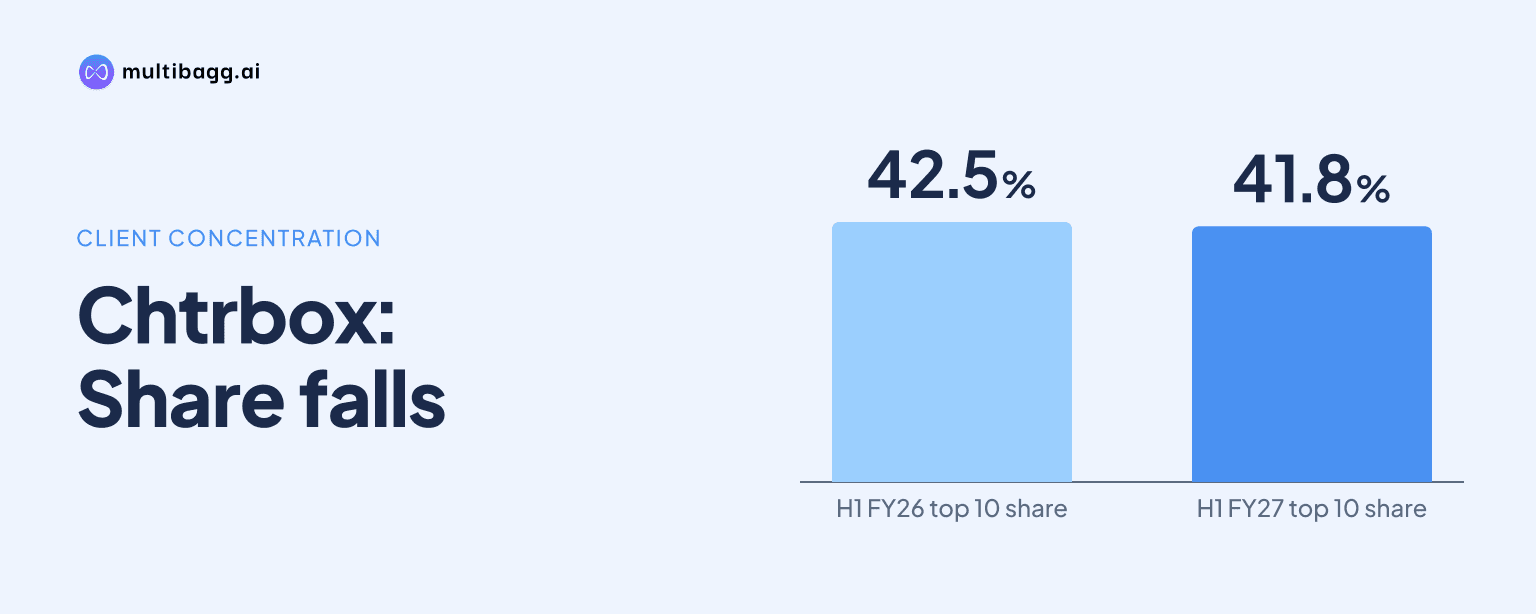
In H1FY27, Chtrbox engaged 436 creators, executed 1,437 campaigns and served 528 brands, while its top 10 clients supplied 41.8% of business. Compared with H1FY26, creator engagement increased by 112, campaigns by 144 and brands served by 70, while the top-10-client share declined by 0.7 percentage points.
Know Chatterbox Technologies inside out
Results, valuation, peers and who's buying, in one view.
How much did Chtrbox's operating scale grow in H1FY27?
Chtrbox expanded its creator, campaign and brand activity in H1FY27 compared with H1FY26. Creators engaged rose to 436 from 324, campaigns executed increased to 1,437 from 1,293, and brands served reached 528 from 458. This equated to additions of 112 creators, 144 campaigns and 70 brands in the corresponding first-half comparison.
Creator engagement increased by about 34.6%, faster than the roughly 15.3% increase in brands served and the 11.1% rise in campaigns executed. The different growth rates show that the creator network expanded more quickly than campaign volumes and customer coverage during the H1FY26-to-H1FY27 comparison.
How concentrated was Chtrbox's client base in H1FY27?
Chtrbox's top 10 clients accounted for 41.8% of business in H1FY27. This was 0.7 percentage points below the 42.5% reported in H1FY26, although the largest 10 customers still represented more than two-fifths of business.
The change occurred alongside an increase in brands served to 528 in H1FY27 from 458 in H1FY26. Chtrbox added 70 brands while the top-10-client share fell by 0.7 percentage points. The presentation does not identify these clients, disclose their individual contributions, or explain whether the lower share reflected new-client revenue, lower major-client revenue, or both.
Which sectors generated Chtrbox's H1FY27 revenue?
Beauty & Lifestyle generated the largest disclosed share of Chtrbox's H1FY27 revenue at 48.9%. Entertainment contributed 18.0%, Hospitality 16.9% and Technology 10.7%, meaning these four categories accounted for 94.5% of the disclosed revenue mix.
Finance accounted for 1.3% of H1FY27 revenue, Health, Fitness, Nutrition, Wellness contributed 3.0%, Other represented 0.9%, and Travel supplied 0.4%. Beauty & Lifestyle's share was 30.9 percentage points above Entertainment, the second-largest reported category.
Beauty & Lifestyle also had the highest disclosed number of brands served at 204, followed by Technology at 55 and Other at 36. Hospitality had 26 brands, Health, Fitness, Nutrition, Wellness had 24, Entertainment had 12, and Finance and Travel had four each. The eight category entries total 365 brands, compared with Chtrbox's overall total of 528 brands served, and the presentation does not allocate the remaining 163 brands in this table.
Got a follow-up? Ask IRIS
How did Chtrbox's business mix change from H1FY26?
Brand Solutions became Chtrbox's largest business line in H1FY27, rising to 44.2% from 41.1% in H1FY26. The 3.1-percentage-point increase moved it ahead of ChtrRepresent, whose business share declined to 40.1% from 45.0%.
ChtrSocial represented 15.7% of H1FY27 business, compared with 13.9% in H1FY26, an increase of 1.8 percentage points. Brand Solutions and ChtrSocial together accounted for 59.9% in H1FY27, up from 55.0% a year earlier. The reported mix therefore shifted away from ChtrRepresent toward the other two disclosed operating lines.
Chtrbox describes Brand Solutions as creator-led campaign strategy, influencer discovery and planning, and integrated campaigns. ChtrRepresent includes personal branding, public relations, brand partnerships, influencer collaborations, content strategy and social-media growth, while ChtrSocial covers creative and social-media strategy, content production, brand films and performance marketing. The presentation reports business shares but gives no revenue amount or margin for these lines.
What operating model supports Chtrbox's creator and brand activity?
Chtrbox describes an integrated platform spanning creator discovery, campaign execution, talent management and monetisation. It reports more than 100 creators under management and more than 100 employees, alongside 436 creators engaged in H1FY27, distinguishing its managed-talent base from the broader creator population used in campaigns.
The company lists Bharat Box, Youth:Ink, Chtr International and Chtr Studios as niche services alongside its core business lines. Bharat Box focuses on vernacular influencer marketing and hyperlocal storytelling, while Youth:Ink is described as a campus ambassador network with an exclusive vivo partnership. Chtr Studios combines branded-content production with influencer reach, and Chtr International is positioned for cross-border work.
Chtrbox reported domestic revenue of 67.4% and international revenue of 32.6% in its presence overview. Management's stated plans include expanding exclusive creator representation, onboarding premium influencers, strengthening in-house production, deepening its tier-2 and tier-3 India footprint, expanding into the Middle East and Asia-Pacific, and advancing proprietary analytics and live dashboards. These are disclosed plans rather than H1FY27 operating outcomes.
Conclusion
Chtrbox's H1FY27 data shows expansion across creators, campaigns and brands, with 436 creators engaged, 1,437 campaigns executed and 528 brands served, compared with 324, 1,293 and 458 respectively in H1FY26. Brand Solutions became the largest line at 44.2%, while Beauty & Lifestyle produced 48.9% of category revenue. At the same time, the top 10 clients supplied 41.8% of business.
The next reporting periods will indicate whether the 0.7-percentage-point decline in top-client concentration continues as management pursues premium creator onboarding, tier-2 and tier-3 expansion, Middle East and Asia-Pacific growth, and in-house production. Investors can also monitor whether Brand Solutions retains its lead over ChtrRepresent and whether the disclosed 32.6% international revenue share changes as cross-border operations develop.