










Classic Vacations’ 2.5% Conversion Beat Acquisition Case
Key highlights
- CV’s adjusted EBITDA-to-GTV conversion was 1.3% in Q2 FY27, compared with 3.4% in Q1 FY27.
- CV’s trailing 12-month adjusted EBITDA-to-GTV conversion was 2.5%, above the 2.4% acquisition base case.
- CV generated Rs 873.7 crore of GTV and Rs 11.0 crore of adjusted EBITDA in Q2 FY27.
- North America Hotels and Ancillaries GTV increased 185% year on year to Rs 1,355 crore in Q2 FY27.
powered by IRIS
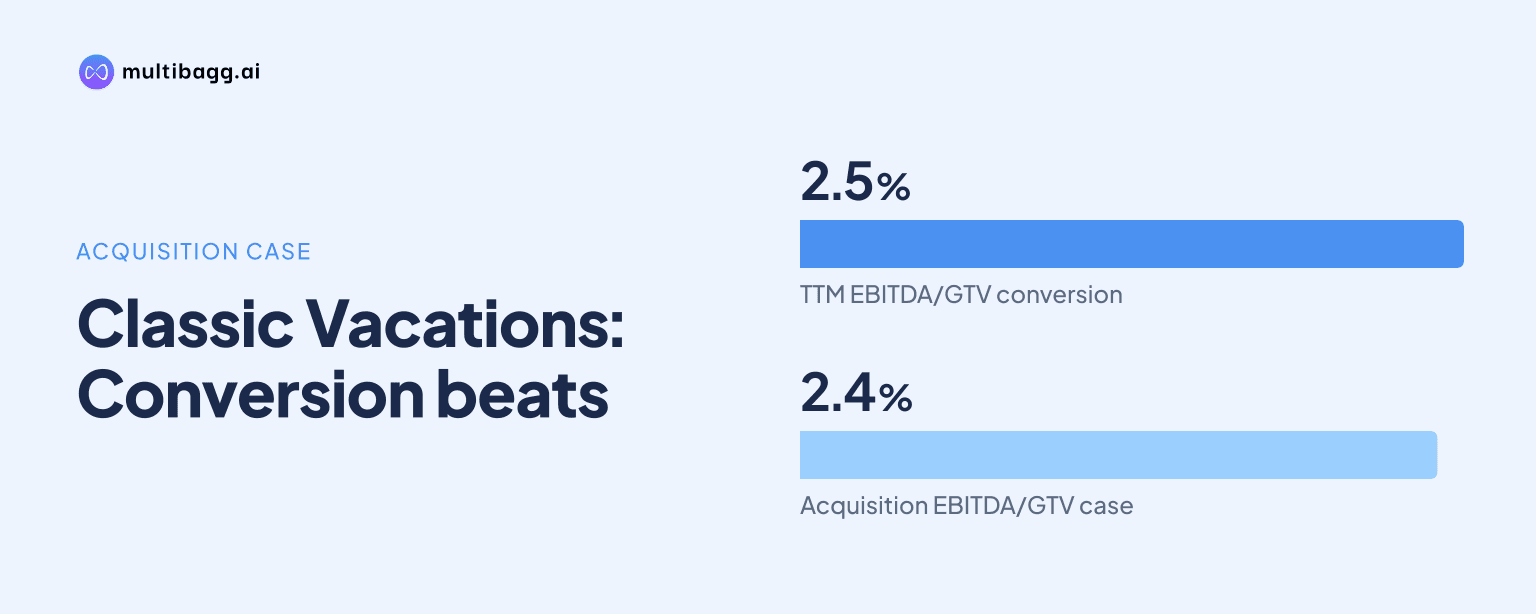
Classic Vacations recorded adjusted EBITDA-to-gross transaction value conversion of 1.3% in Q2 FY27, versus 3.4% in Q1 FY27, but its trailing 12-month conversion of 2.5% exceeded TBO Tek’s 2.4% acquisition base case. Management attributed the quarterly decline to North America’s weakest check-in season and a partly fixed cost base.
Know TBO Tek inside out
Results, valuation, peers and who's buying, in one view.
Why did CV’s Q2 FY27 conversion fall to 1.3%?
CV’s adjusted EBITDA-to-GTV conversion fell to 1.3% in Q2 FY27 because lower seasonal GTV was measured against a partly fixed selling, general and administrative expense base. Management described Q2 as North America’s weakest quarter for check-in seasonality, while Q1 is the region’s seasonal peak. It said that this mix created reverse operating leverage in Q2, in contrast with the positive operating leverage reported in Q1 FY27.
CV generated Rs 873.7 crore of GTV, Rs 216.0 crore of total income and Rs 120.1 crore of gross profit in Q2 FY27. Selling, general and administrative expenses excluding employee stock option plan costs were Rs 109.1 crore, resulting in adjusted EBITDA of Rs 11.0 crore. The presentation reported an implied take rate of 24.7% and gross profit equal to 13.8% of GTV, before the effect of the quarterly cost base.
The figures use a check-in basis, which the presentation says is consistent with CV’s revenue-accounting methodology. That basis is relevant because the quarterly seasonal pattern reflects completed check-ins rather than booking timing. CV completed a full year with TBO Tek on September 30, 2026, and its financials were then fully included in the TBO Tek comparison base.
How did CV compare with TBO Tek’s organic business in Q2 FY27?
CV matched TBO Tek’s organic business at 1.3% adjusted EBITDA-to-GTV conversion in Q2 FY27, although CV reported higher commercial ratios before overhead. CV’s implied take rate was 24.7% and gross profit was 13.8% of GTV, compared with 6.0% and 4.0%, respectively, for the organic business. The source therefore shows that the equal quarterly conversion rates followed different revenue and gross-profit structures.
TBO Tek’s organic GTV rose 22% to Rs 10,890 crore in Q2 FY27 from Rs 8,901 crore in Q2 FY26. Its total income increased 14% to Rs 649.6 crore, gross profit increased 21% to Rs 440.9 crore and adjusted EBITDA rose 36% to Rs 141.4 crore. Organic adjusted EBITDA-to-GTV conversion improved from 1.2% in Q2 FY26 to 1.3% in Q2 FY27, while CV’s disclosed comparison is with its 3.4% rate in Q1 FY27.
Consolidated GTV was Rs 11,695 crore, rather than the direct sum of the organic and CV figures, because the presentation records Rs 68.70 crore of intercompany elimination on GTV sales to CV. Consolidated adjusted EBITDA increased 47% to Rs 152.4 crore from Rs 104.0 crore in Q2 FY26 before acquisition-related costs. Consolidated total income rose 53% to Rs 865.6 crore, with CV contributing Rs 216.0 crore of that amount.
Got a follow-up? Ask IRIS
Did CV exceed its acquisition base case over 12 months?
CV exceeded its acquisition base case over the trailing 12 months, reporting a 2.5% adjusted EBITDA-to-GTV conversion against the 2.4% base case disclosed at acquisition. The 0.1-percentage-point difference compares a trailing 12-month measure with the initial acquisition assumption, not with Q2 FY27 alone. Management described the 2.5% result as slightly above its original base case.
The presentation reports trailing 12-month GTV of $463.6 million, revenue of $116.7 million, gross profit of $59.9 million and adjusted EBITDA of $11.5 million for CV. It gives the resulting adjusted EBITDA-to-GTV conversion as 2.5%. The source does not disclose a revised acquisition conversion target or a separate forward conversion target for CV.
The distinction between the 2.5% trailing result and the 1.3% Q2 FY27 result is material to the seasonal comparison. The trailing measure includes the Q1 period that management identifies as North America’s peak check-in season, whereas Q2 is its weakest seasonal quarter. Management attributed the Q2 outcome to that seasonal volume pattern and the partly fixed selling, general and administrative cost base.
What does North American seasonality mean for CV’s results?
North American seasonality means CV’s conversion can differ substantially between Q1 and Q2 because management identifies Q1 as the peak check-in period and Q2 as the weakest. The sequential change was 2.1 percentage points, from 3.4% in Q1 FY27 to 1.3% in Q2 FY27. Management’s explanation was reverse operating leverage when softer seasonal GTV was spread across partly fixed costs.
North America Hotels and Ancillaries GTV rose 185% year on year to Rs 1,355 crore in Q2 FY27 from Rs 476 crore in Q2 FY26. The region represented 17% of Hotels and Ancillaries GTV and had 5,100 transacting agents, two countries with feet-on-street and two source markets. The presentation notes that transacting agents for CV are calculated on a check-in basis.
TBO Tek states that its organic North American operation concentrates on premium-to-early-luxury travel, while CV targets the ultra-luxury segment. The presentation does not provide a standalone prior-year GTV figure for CV, so the 185% North American regional growth rate is not a disclosed standalone CV growth rate. Its Q2 FY27 CV data instead show Rs 120.1 crore of gross profit and Rs 109.1 crore of selling, general and administrative expenses excluding employee stock option costs.
Conclusion
CV’s 1.3% adjusted EBITDA-to-GTV conversion in Q2 FY27 reflects the seasonal trough described by management, while its 2.5% trailing conversion was 0.1 percentage point above the 2.4% acquisition base case. In the quarter, CV contributed Rs 873.7 crore of GTV, Rs 216.0 crore of total income and Rs 11.0 crore of adjusted EBITDA to TBO Tek’s consolidated results.
The next comparison is whether North America’s peak Q1 check-in period again produces positive operating leverage after the Q2 FY27 reversal. Management has not disclosed a revised CV conversion target, leaving the 2.4% acquisition base case and the trailing 2.5% result as the stated reference points for future performance.