










TBO organic adjusted EBITDA rose 36% as support needs fell
Key highlights
- TBO organic adjusted EBITDA rose 36% year on year to Rs 141 crore in Q2’FY27.
- Organic gross profit increased 21% to Rs 441 crore, while organic revenue grew 14% to Rs 650 crore.
- Organic monthly transacting buyers reached 32,412, and international organic buyers increased 17.4% to 14,449.
- Hotels and Ancillary gross-profit margin rose to 5.5% of GTV from 5.2% in Q1’FY27.
powered by IRIS
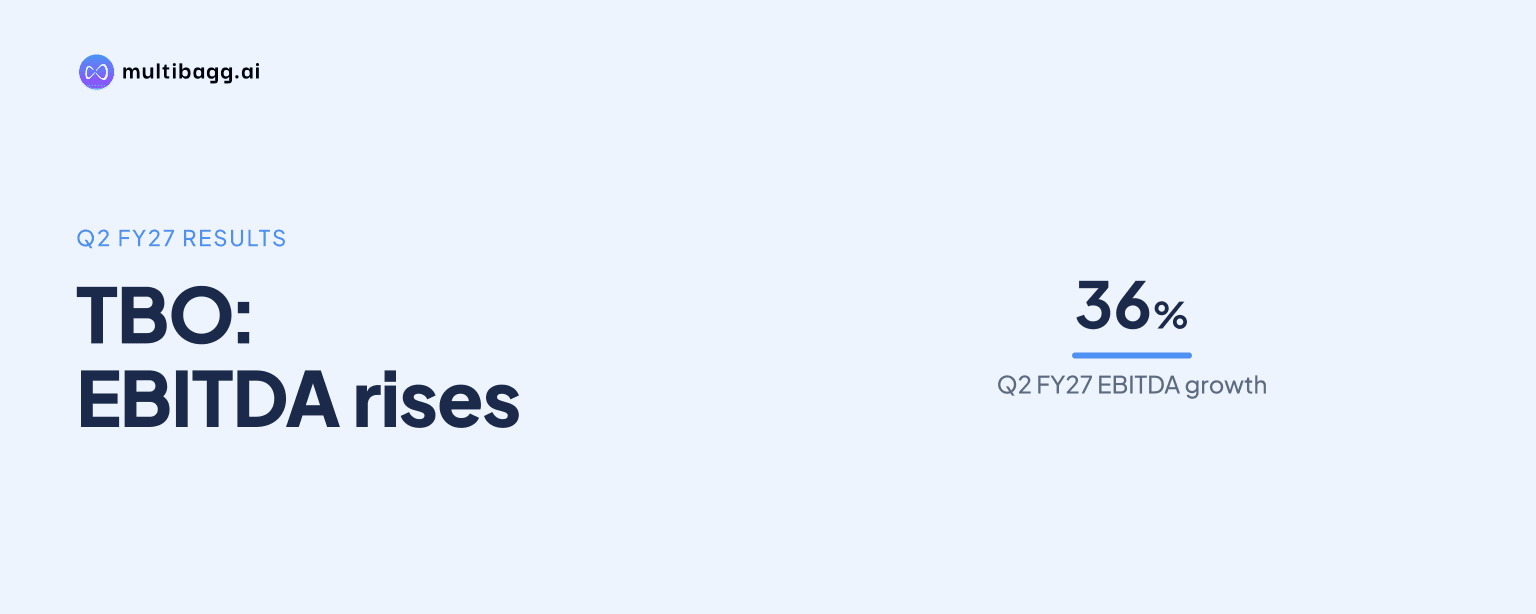
TBO Tek Limited reported 36% year-on-year growth in organic adjusted earnings before interest, tax, depreciation and amortisation (adjusted EBITDA) to Rs 141 crore in Q2’FY27, versus 21% growth in gross profit, as monthly transacting buyers reached 32,412. Management attributed the faster EBITDA growth to capacity from prior key account manager hiring and lower support needs as agents adopted self-service.
Know TBO Tek inside out
Results, valuation, peers and who's buying, in one view.
How much did TBO’s organic profitability grow in Q2’FY27?
TBO’s organic adjusted EBITDA increased 36% year on year to Rs 141 crore in Q2’FY27, while gross profit rose 21% to Rs 441 crore and revenue grew 14% to Rs 650 crore. The difference between EBITDA and gross-profit growth is the reported evidence of operating leverage in the quarter.
Organic gross transaction value (GTV), the value of travel transactions processed, rose 22% year on year to Rs 10,890 crore. On a constant-currency basis, TBO reported 16% organic GTV growth, 14% gross-profit growth and 27% adjusted EBITDA growth. The company calculates constant-currency profit-and-loss figures by translating Tek Travels FZCO’s current-period results at the prior-period average exchange rate, while GTV uses the prior-period average daily rate.
TBO said the 36% adjusted EBITDA comparison uses Q2’FY26 adjusted EBITDA before merger-and-acquisition costs. Its reported business, comprising TBO Organic and Classic Vacations, delivered Rs 152 crore of adjusted EBITDA, Rs 561 crore of gross profit and Rs 866 crore of revenue in Q2’FY27, with reported EBITDA up 47% year on year.
Why did TBO’s adjusted EBITDA grow faster than gross profit?
TBO said its larger key account manager, or KAM, base enables commercial teams to engage more agents without a proportionate rise in costs. Management said new agents need less assistance once they become familiar with the self-service platform, freeing commercial capacity to establish additional relationships.
The company linked this mechanism to its prior-year investment in KAM hiring. Monthly transacting buyers in organic international operations increased 17.4% year on year to a quarterly record of 14,449 in Q2’FY27, while total organic monthly transacting buyers rose 6% to 32,412. Management views the international buyer increase as an indicator of continuing benefits from that hiring.
Organic GTV increased 22%, faster than the 6% rise in total monthly transacting buyers. The shareholder letter does not disclose KAM headcount, transaction frequency or booking value per buyer, so it does not separate the contribution from more buyers and greater activity by existing buyers.
Which businesses supported TBO’s Q2’FY27 growth?
TBO’s India business reported 14.1% year-on-year GTV growth in Q2’FY27 despite higher fuel prices and continued stress in the Middle East corridor. India Air GTV rose 14.5%, while Hotels and Ancillary GTV increased 12.2% to Rs 581 crore from Rs 518 crore in Q2’FY26.
Hotels and Ancillary gross-profit margin improved sequentially to 5.5% of GTV in Q2’FY27 from 5.2% in Q1’FY27. That 0.3-percentage-point movement occurred as organic gross profit grew 21%, ahead of 14% organic revenue growth, although TBO did not allocate the gross-profit increase by region or product.
Europe led the Hotels and Ancillary geographic growth disclosed by TBO, with GTV increasing 36% to Rs 2,855 crore from Rs 2,103 crore. North America grew 185% to Rs 1,355 crore from Rs 476 crore, while Asia Pacific rose 33% to Rs 701 crore from Rs 527 crore; Latin America grew 9% to Rs 566 crore from Rs 517 crore.
Got a follow-up? Ask IRIS
What did TBO report about Middle East conditions?
TBO reported a Q2’FY27 recovery in Middle East Hotels and Ancillary activity, with regional GTV growing 10% year on year on a constant-currency basis. The reported regional GTV was Rs 1,830 crore, up 20% from Rs 1,524 crore in Q2’FY26, with exchange rates accounting for the difference between the reported and constant-currency growth rates.
Management said the underlying Middle East market was unlikely to have fully recovered, but that TBO’s performance could indicate market-share gains driven by service differentiation and reliability. It also said a subsequent escalation in Saudi Arabia had amplified the fluidity of regional conditions, making this geography a disclosed operating uncertainty.
Middle East and Africa represented 23% of TBO’s Hotels and Ancillary GTV in Q2’FY27, compared with Europe’s 36% and North America’s 17%. The letter does not quantify the effect of the Saudi Arabia escalation on bookings, revenue, gross profit or adjusted EBITDA after the quarter ended.
How does Classic Vacations affect TBO’s operating plan?
TBO said Classic Vacations completed its first year within the group and adds advisor relationships, luxury expertise and supplier partnerships to the wider platform. During Q2’FY27, TBO meaningfully expanded Classic Vacations’ sales team to maintain high-touch relationships with key customers while increasing the customer base.
Management said the added sales costs would be partly offset by cost-optimisation initiatives. It cited early improvement in Classic Vacations’ trailing-12-month adjusted EBITDA conversion from GTV to 2.5%, compared with the 2.4% estimate at the time of acquisition; this is a management-cited margin measure rather than a disclosed quarterly EBITDA amount.
Reported monthly transacting buyers were 34,529 in Q2’FY27, compared with 32,412 for the organic business. TBO said Classic Vacations’ North American transacting-agent and geographic GTV measures are calculated on a check-in basis, reflecting its revenue-accounting methodology and limiting direct comparability with every organic operating measure.
What should readers watch after Q2’FY27?
The main disclosed issues to watch are continued self-service adoption, cost optimisation at Classic Vacations and conditions in the Middle East. In Q2’FY27, organic adjusted EBITDA growth of 36% exceeded organic gross-profit growth of 21%, while management’s explanation depended on commercial teams supporting more agents without proportionate costs.
TBO ended 30 September 2026 with Rs 2,060 crore of cash and cash equivalents, including bank balances, deposits and liquid investments. The company also prepaid part of its term loan during Q2’FY27, reducing the outstanding balance, but the shareholder letter presents the debt amounts in US dollars and provides no rupee-denominated debt balance or next-quarter earnings target.
Conclusion
TBO’s Q2’FY27 figures show that organic adjusted EBITDA growth of 36% exceeded both 21% gross-profit growth and 14% revenue growth. Management attributed that spread to the capacity created by earlier KAM hiring and to lower support requirements as more agents use the self-service platform.
The next evidence will come from whether buyer growth, particularly the 17.4% increase in organic international buyers, continues alongside the integration of Classic Vacations and its sales-team expansion. Management also plans cost optimisation at Classic Vacations, while the disclosed fluidity in Saudi Arabia and the wider Middle East remains a key unresolved regional factor.