










TBO Tek Q2 FY27 revenue rises 53% as hotel GTV gains 39%
Key highlights
- TBO Tek reported Q2 FY27 revenue of Rs 866 crore, up 53% year on year.
- Hotels + Ancillary GTV rose 39% to Rs 7,889 crore in Q2 FY27.
- Adjusted EBITDA increased 47% to Rs 152 crore, while PAT rose 13% to Rs 76 crore.
- Cash and cash equivalents stood at Rs 2,060 crore on September 30, 2026.
powered by IRIS
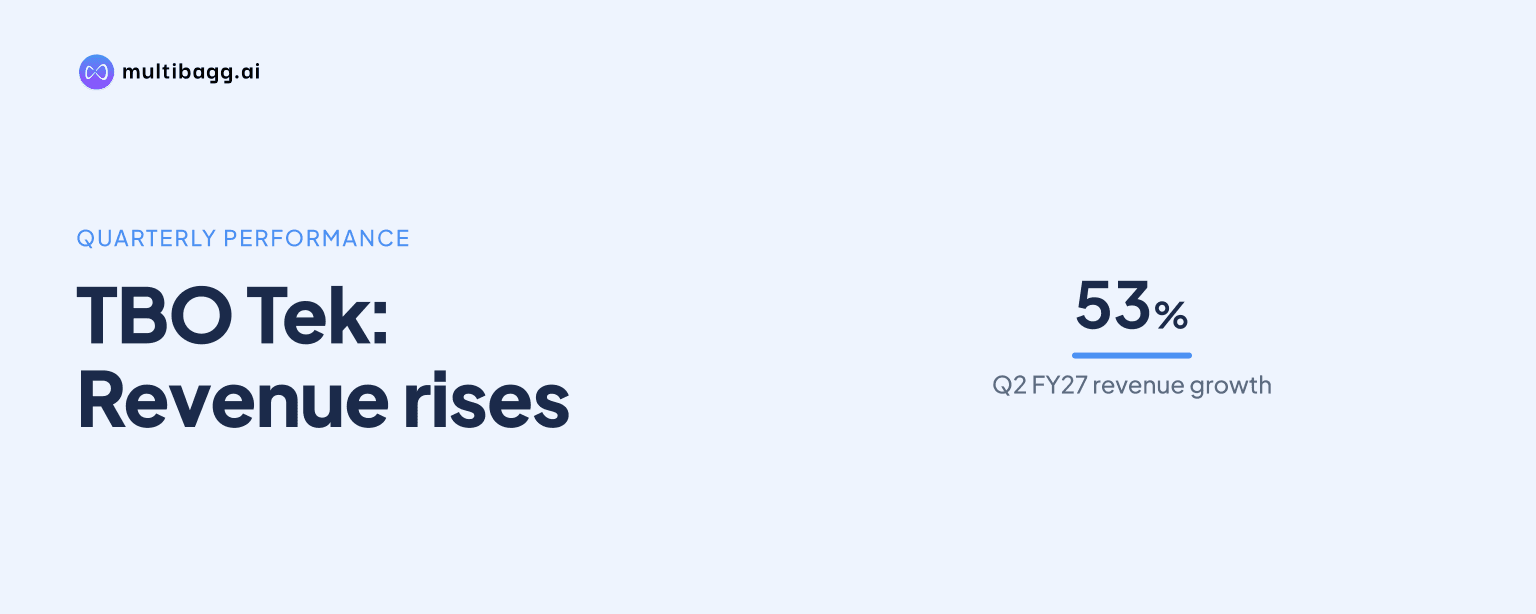
TBO Tek Limited reported consolidated Q2 FY27 revenue from operations of Rs 866 crore, up 53% year on year, while Hotels + Ancillary gross transaction value, or GTV, rose 39% to Rs 7,889 crore. Gross profit increased 54% to Rs 561 crore, ahead of the 31% rise in total GTV to Rs 11,695 crore.
Know TBO Tek inside out
Results, valuation, peers and who's buying, in one view.
How did TBO Tek perform in Q2 FY27?
TBO Tek increased revenue, gross profit, adjusted earnings before interest, tax, depreciation and amortisation, or adjusted EBITDA, and profit after tax in Q2 FY27. Revenue from operations rose to Rs 866 crore from Rs 568 crore in Q2 FY26, while gross profit rose to Rs 561 crore from Rs 363 crore over the same period.
Adjusted EBITDA was Rs 152 crore in Q2 FY27, compared with Rs 104 crore a year earlier, an increase of 47%. Profit after tax, or PAT, rose 13% to Rs 76 crore from Rs 68 crore. The release does not provide a line-by-line reconciliation explaining why PAT growth was below the adjusted EBITDA growth rate.
Revenue grew 22 percentage points faster than total GTV in Q2 FY27, while gross profit grew 23 percentage points faster. In absolute terms, total GTV increased by Rs 2,794 crore, revenue rose by Rs 298 crore and gross profit increased by Rs 198 crore. TBO Tek said continued operating leverage drove organic margin expansion.
Which business drove TBO Tek's GTV growth?
Hotels + Ancillary was TBO Tek's larger and faster-growing GTV business in Q2 FY27, at Rs 7,889 crore and 39% year-on-year growth. Airlines GTV reached Rs 3,807 crore, up 18%, leaving Hotels + Ancillary ahead by 21 percentage points on the disclosed growth rates.
TBO Tek reported broad-based growth across India, Asia-Pacific, Europe and North America during Q2 FY27, alongside a strong recovery in the Middle East business. For Hotels + Ancillary, GTV in Europe grew 36% year on year and GTV in Asia-Pacific grew 33%. The company also identified geopolitical disruption in the Middle East and higher fuel prices as macro headwinds during the quarter.
In India, TBO Tek reported 14.5% year-on-year growth for Airlines and 12.2% growth for Hotels + Ancillary in Q2 FY27. The release did not disclose the India-specific GTV, revenue or profit amounts behind those growth rates. It described the India business as continuing a sustained growth trajectory.
Got a follow-up? Ask IRIS
What do TBO Tek's buyer numbers indicate?
TBO Tek had 34,529 monthly transacting buyers, or MTBs, in Q2 FY27, up 13% year on year. The company cited expanding agent activity on the platform as part of the quarter's performance, while total GTV rose 31%, faster than the reported MTB increase.
MTBs in TBO Tek's organic international business increased 17.4% year on year to a record 14,449 during Q2 FY27. TBO Tek said it views that increase as a leading indicator of benefits from key account manager, or KAM, hiring undertaken in the previous year. The release did not provide separate revenue, GTV or profitability for this buyer cohort.
Co-founder and Joint Managing Director Gaurav Bhatnagar said earlier commercial investments were generating greater platform activity without a proportionate increase in costs. He said TBO Tek's strategy is to expand distribution while using technology to improve productivity and lower cost to serve. These are management's explanations of the mechanism behind the Rs 152 crore adjusted EBITDA result, not separate quantified cost disclosures.
What was TBO Tek's cash position at September-end?
TBO Tek reported cash and cash equivalents of Rs 2,060 crore as of September 30, 2026, after a term-debt prepayment. The reported balance includes bank balances, bank deposits and liquid investments, according to the November 2, 2026 release.
The release does not disclose TBO Tek's remaining term debt, interest expense, debt maturity profile or the amount of operating cash flow for Q2 FY27. It also gives no capital-expenditure, working-capital movement or free-cash-flow figure. As a result, the Rs 2,060 crore balance establishes the reported period-end liquidity position but does not show quarterly cash generation.
The September 30, 2026 cash balance accompanied a quarter in which TBO Tek reported Rs 152 crore of adjusted EBITDA and Rs 76 crore of PAT. The company released the unaudited consolidated results on November 2, 2026, and said detailed commentary would be available in its Q2 FY27 shareholders' letter.
Conclusion
TBO Tek's Q2 FY27 results show Hotels + Ancillary growing faster than Airlines, with Rs 7,889 crore of GTV and 39% growth versus Rs 3,807 crore and 18% for Airlines. That business mix contributed to total GTV growth of 31%, while revenue increased 53% to Rs 866 crore and gross profit rose 54% to Rs 561 crore.
The next reported indicators to watch are whether the 34,529 MTB base, including 14,449 organic international MTBs, continues to grow as TBO Tek pursues distribution expansion, technology-led productivity and benefits from earlier KAM hiring. Management also identified Middle East geopolitical disruption and higher fuel prices as unresolved macro factors affecting the business.