










CleanMax commissions 1,427 MW over trailing 12-month period
Key highlights
- CleanMax commissioned 1,427 MW in the trailing 12 months to H1 FY27, compared with 447 MW a year earlier.
- Bikaner II curtailment declined from 70% in Q1 FY27 to 26% in October 2026.
- CleanMax had 2.6 gigawatts of contracted renewable-energy power-sales capacity under execution on September 30, 2026.
- Actual construction costs were 94.71% of budget for projects commissioned in H1 FY27.
powered by IRIS
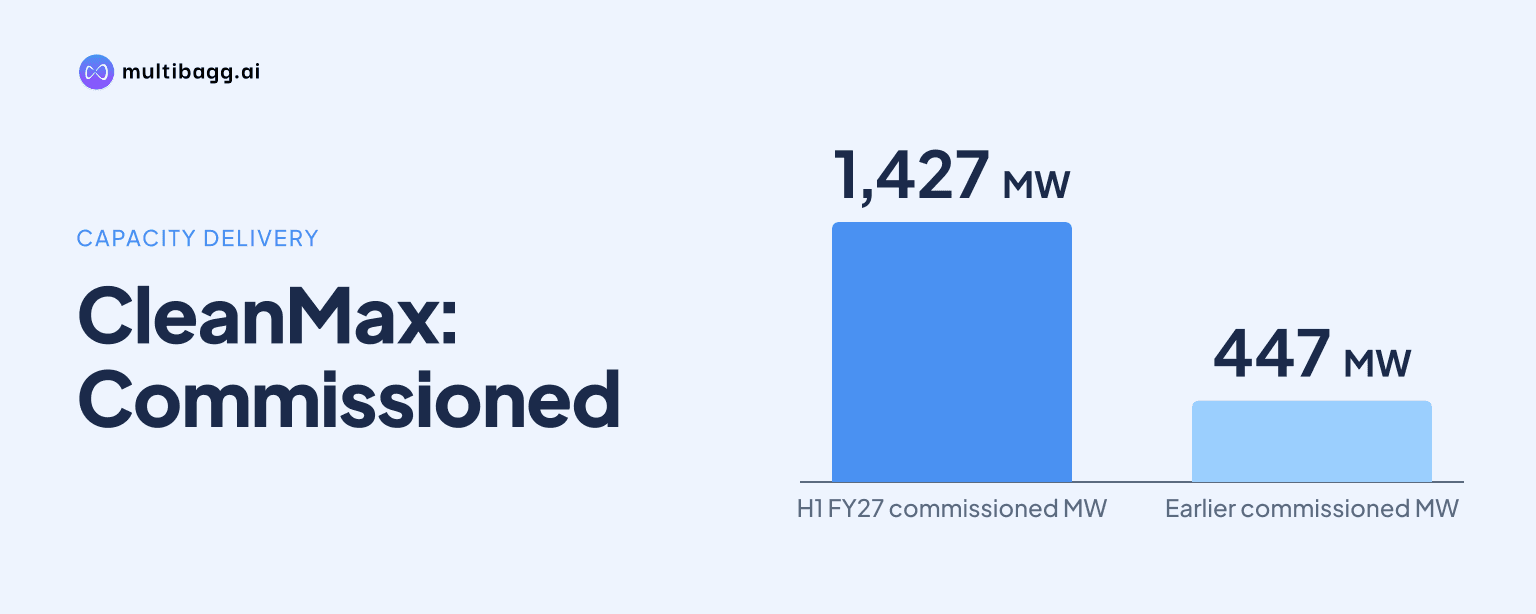
Clean Max Enviro Energy Solutions Limited commissioned 1,427 megawatts (MW) of renewable-energy power-sales capacity in the trailing 12 months ended the first half (H1) of financial year (FY) 2027, compared with 447 MW a year earlier. CleanMax also reported that curtailment at its 525-megawatt-peak (MWp) Bikaner II project fell from 70% in Q1 FY27 to 26% in October 2026.
Know Clean Max Enviro Energy Solutions inside out
Results, valuation, peers and who's buying, in one view.
How much capacity did CleanMax commission in the trailing year?
CleanMax commissioned 1,427 MW of renewable-energy power-sales capacity in the trailing 12 months to H1 FY27, consisting of 902 MW in the STU category and 525 MW in the CTU category shown in its presentation. The prior-year trailing period contained 447 MW, all in the STU category.
The 1,427 MW total was 980 MW above the 447 MW recorded in the trailing 12 months to H1 FY26. The increase came from STU commissioning rising by 455 MW to 902 MW and from the addition of 525 MW in the CTU category.
What do CleanMax's execution metrics show?
CleanMax reported 550 MW of additional renewable-energy power-sales capacity commissioned in H1 FY27, while management guided for more than 1.5 gigawatts of additions for FY27. The disclosed H1 commissioning is therefore the delivered volume reported against management's full-year plan.
CleanMax had 2.6 gigawatts of contracted renewable-energy power-sales capacity under execution as of September 30, 2026. Its on-books capacity reached 6,270 MW on that date, up by 585 MW from 5,685 MW on March 31, 2026 and by 1,848 MW from 4,422 MW on March 31, 2025.
The execution pipeline had a weighted-average power-purchase agreement tenor of 23 years and a disclosed tariff of Rs 3.98 per kilowatt-hour for the 2.6-gigawatt under-execution portfolio. CleanMax also reported 606 commercial and industrial customers, operations in seven states, and contracts in a further three states yet to be executed as of September 30, 2026.
How did CleanMax's costs and operating measures change?
CleanMax reported actual construction costs of 94.71% of budget for projects commissioned in H1 FY27, versus 97.20% in FY26, 95.24% in FY25 and 95.54% in FY24. The company defines actual cost as construction spending on projects commissioned in the relevant period, excluding land, while budget reflects the construction cost set at project inception.
The H1 FY27 actual-cost-to-budget result was 2.49 percentage points below FY26's 97.20%. The presentation describes delivery as on time and within budget, and the disclosed series shows that H1 FY27 had the lowest actual-cost-to-budget ratio among the four reported periods.
Grid uptime was 98.44% in the trailing 12 months to H1 FY27, down 0.73 percentage points from 99.17% in the comparable period a year earlier. Over the same comparison, wind plant load factor rose to 37% from 36%, offsite solar grid-adjusted plant load factor rose to 28% from 24%, and hybrid plant load factor rose to 51% from 47%.
Got a follow-up? Ask IRIS
How much has CleanMax Bikaner II curtailment fallen?
CleanMax reported that Bikaner II curtailment fell to 26% in October 2026 from 70% in Q1 FY27, a reduction of 44 percentage points. The project is identified in the presentation as a 525-MWp CTU project, and its Q2 FY27 average curtailment was 48%.
The monthly data show curtailment at 50% in July 2026, 49% in August, 44% in September and 26% in October. October was 22 percentage points below the Q2 FY27 average of 48% and 18 percentage points below September's 44%.
CleanMax defines curtailment as uncurtailed generation less generation after the transmission-access cap implied by T-GNA, expressed as a percentage of uncurtailed generation. The metric measures the share of potential generation affected by that cap, rather than a change in Bikaner II's 525-MWp installed capacity.
What should investors watch in CleanMax's FY27 plan?
The principal disclosed delivery benchmark is management's guidance for more than 1.5 gigawatts of renewable-energy power-sales additions in FY27, after 550 MW was commissioned in H1 FY27. The 2.6 gigawatts under execution at September 30, 2026 provides the contracted project base from which further commissioning can occur.
CleanMax's customer mix has also changed as capacity expanded to 6,270 MW. Data and artificial-intelligence customers represented 41% of on-books capacity at September 30, 2026, compared with 42% at March 31, 2026 and 14% at March 31, 2024; conventional commercial and industrial customers accounted for the remaining 59% at September 2026.
Repeat business represented 85% of new power-purchase agreements at the current reporting point, up from 74% in FY26 and 77% in FY25. Renewable-energy power-sales receivable days were 22, compared with 25 in FY26 and 26 in FY25, while 83% of customers by MW in Q2 FY27 were rated AA, AAA or were multinational subsidiaries.
Conclusion
CleanMax's reported trailing-12-month commissioning rose to 1,427 MW from 447 MW a year earlier, supported by growth in both the STU category and a 525 MW CTU contribution. H1 FY27 projects recorded actual costs at 94.71% of budget, while wind, offsite solar and hybrid plant load factors all increased despite grid uptime declining to 98.44%.
The next disclosed benchmark is management's target of more than 1.5 gigawatts of renewable-energy power-sales additions in FY27, following 550 MW commissioned in H1 FY27. Investors can also watch whether Bikaner II curtailment remains near October 2026's 26% level and how the 2.6-gigawatt portfolio under execution converts into operating capacity.