










CleanMax H1 profit rises 532% as renewable sales scale rapidly
Key highlights
- CleanMax reported H1 FY27 PAT of Rs 120.1 crore, up 532% from Rs 19 crore in H1 FY26.
- H1 FY27 revenue from operations rose 67% to Rs 1,559.8 crore, including Rs 1,132.3 crore from RE Power Sales.
- RE Power Sales EBITDA margin reached 84.0% in H1 FY27, compared with 83.5% in FY26.
- Net debt was Rs 13,838.2 crore at H1 FY27, while the overall borrowing cost declined to 8.3%.
powered by IRIS
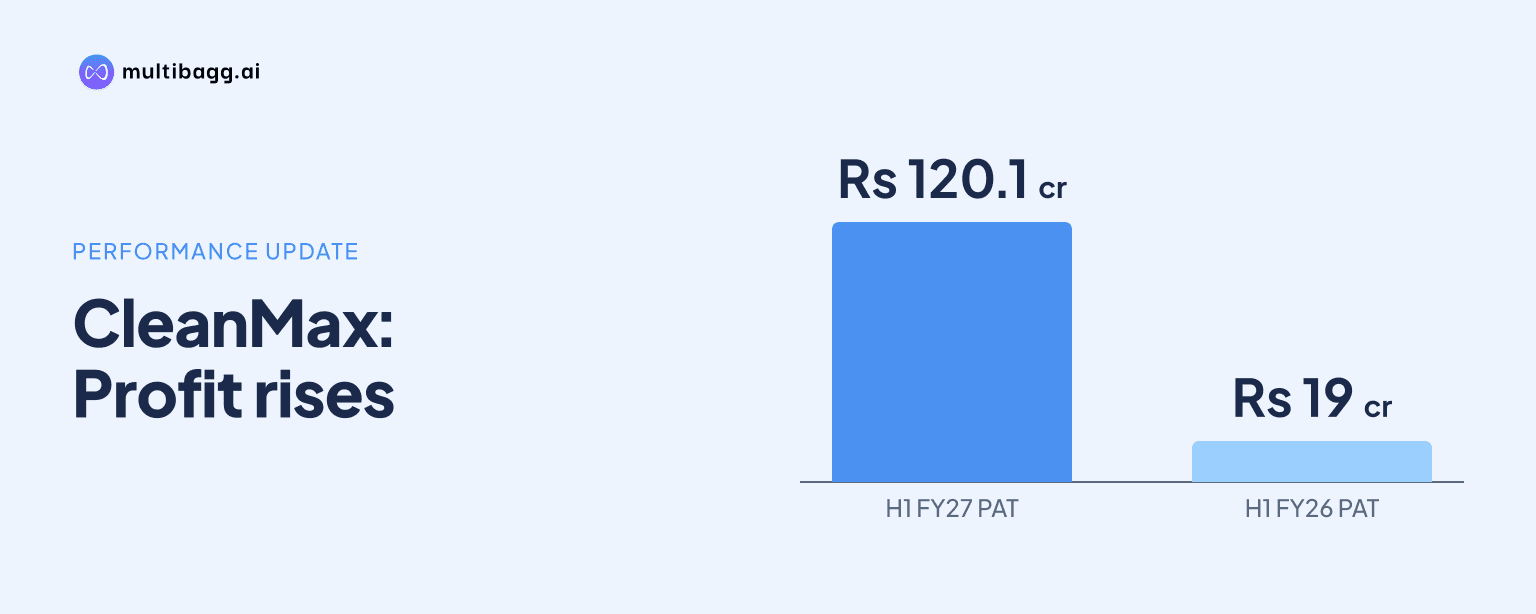
Clean Max Enviro Energy Solutions Limited reported H1 FY27 profit after tax (PAT) of Rs 120.1 crore, up 532% year on year, as revenue from operations rose 67% to Rs 1,559.8 crore and renewable-power capacity commissioning increased. CleanMax’s overall weighted average borrowing cost was 8.3% at 30 September 2026, down from 8.8% at 31 March 2026.
Know Clean Max Enviro Energy Solutions inside out
Results, valuation, peers and who's buying, in one view.
How did CleanMax’s H1 FY27 earnings change?
CleanMax’s reported PAT rose from Rs 19 crore in H1 FY26 to Rs 120.1 crore in H1 FY27, while revenue from operations increased from Rs 933 crore to Rs 1,559.8 crore. Earnings before interest, tax, depreciation and amortisation (EBITDA) increased 58% to Rs 1,010.6 crore from Rs 637.9 crore, and adjusted EBITDA rose 56% to Rs 1,047.2 crore.
CleanMax’s Q2 FY27 revenue rose 37% to Rs 727.7 crore from Rs 530.6 crore in Q2 FY26, slower than the 67% H1 growth rate. Q2 PAT increased 82% to Rs 64.9 crore from Rs 35.6 crore, and management attributed reported PAT growth to a larger portfolio of assets operational for more than one year as of 30 September 2026.
What drove CleanMax’s H1 FY27 revenue growth?
CleanMax said capacity commissioning drove its 67% H1 FY27 revenue growth, with RE Power Sales rising 57% to Rs 1,132.3 crore. RE Services revenue increased 107% to Rs 423.8 crore from Rs 205 crore, although Q2 FY27 RE Services revenue declined 24% to Rs 123.6 crore from Rs 163.7 crore in Q2 FY26.
RE Power Sales capacity commissioned in the trailing 12 months to H1 FY27 was 1,427 megawatts (MW), compared with 447 MW in the trailing 12 months to H1 FY26. The H1 FY27 total included 902 MW connected through state transmission utility infrastructure and 525 MW through central transmission utility infrastructure.
Operating indicators improved across the technologies shown in the presentation. Trailing-12-month wind plant load factor (PLF) increased to 37% from 36%, grid-adjusted offsite solar PLF rose to 28% from 24%, and hybrid PLF reached 51% from 47%.
The 525-megawatt-peak Bikaner II central-transmission project nevertheless recorded average curtailment of 48% in Q2 FY27, compared with 70% in Q1 FY27. Curtailment decreased from 50% in July 2026 to 26% in October 2026, with the presentation defining it as the reduction in generation after the transmission-general network access-implied cap relative to uncurtailed generation.
How did CleanMax’s power-sales margins develop?
CleanMax’s RE Power Sales EBITDA margin was 84.0% in H1 FY27, compared with 83.5% in FY26, 81.9% in FY25 and 75.3% in FY23. Gross margin was 92.8% in H1 FY27 versus 92.5% in FY26, while selling, general and administrative expenses (SG&A) were 9.0% of total income, down from 9.4% in FY26 and 18.2% in FY23.
CleanMax presents the reduction in SG&A as operating leverage from scale. The company’s definitions exclude one-time and non-cash expenses from EBITDA and SG&A; adjusted EBITDA of Rs 1,047.2 crore exceeded reported EBITDA of Rs 1,010.6 crore by Rs 36.6 crore in H1 FY27.
Projects operational for more than one year contributed Rs 717.9 crore of H1 FY27 adjusted EBITDA, compared with Rs 268.3 crore from projects operational for less than one year and Rs 61 crore from RE Services. The Rs 36.6 crore of non-cash expense included net unrealised foreign-exchange loss, employee stock-option-plan amortisation and other notional expenses.
Got a follow-up? Ask IRIS
What does CleanMax’s asset base show about expansion?
CleanMax’s gross block increased to Rs 15,182 crore at H1 FY27 from Rs 12,823.2 crore at FY26, while capital work in progress rose to Rs 6,745.7 crore from Rs 5,339.2 crore. The presentation attributes gross-block growth to an increase in commissioned and under-construction capacity.
Net debt increased to Rs 13,838.2 crore at H1 FY27 from Rs 9,684.1 crore at FY26. As of 30 September 2026, projects operational for more than one year accounted for Rs 6,074.9 crore of net debt, newer operational projects for Rs 2,642.2 crore, and under-construction assets and other items for Rs 5,121 crore.
Total equity increased to Rs 5,953.2 crore at H1 FY27 from Rs 5,523.5 crore at FY26. CleanMax disclosed that Rs 599 crore of initial public offering proceeds had been used for debt repayment, while its net-debt definition deducts cash, specified bank balances, long-term margin money and current investments from total debt.
How did CleanMax’s borrowing cost and debt mix change?
CleanMax’s overall weighted average cost of borrowing declined to 8.3% at 30 September 2026, from 8.8% at 31 March 2026 and 9.5% at 31 March 2025. Project-finance borrowing cost also fell, reaching 8.2% at 30 September 2026 versus 8.5% at 31 March 2026 and 9.2% at 31 March 2025.
Fixed-rate debt represented 53.7% of gross debt at September 2026, with floating-rate debt accounting for 46.3%. CleanMax also reported a CRISIL AA rating in September 2026 and an approximately 23-year weighted average power purchase agreement tenor.
The higher debt balance coincided with a Rs 2,358.8 crore increase in gross block and a Rs 1,406.5 crore rise in capital work in progress between FY26 and H1 FY27. The presentation states that foreign-currency loans are measured against power purchase agreement revenues in the respective currencies, so no hedging is required for those loans.
Conclusion
CleanMax’s H1 FY27 results combined revenue growth with a disproportionately larger increase in reported PAT, supported by higher RE Power Sales, a greater contribution from assets operational for more than one year and lower SG&A intensity in the power-sales segment. EBITDA rose 58% to Rs 1,010.6 crore, while RE Power Sales EBITDA margin increased to 84.0% from 83.5% in FY26.
The disclosed matters to watch are the conversion of Rs 6,745.7 crore of capital work in progress into operating assets, the contribution from projects in their first operational year and the unresolved Bikaner II curtailment trend after it fell to 26% in October 2026. Financing will also remain relevant after net debt reached Rs 13,838.2 crore despite the reduction in overall borrowing cost to 8.3%.