










CleanMax targets Rs 3,000 crore FY28 EBITDA from 4.6 GW
Key highlights
- CleanMax targets minimum FY28 reported EBITDA of Rs 3,000 crore, compared with Rs 1,295 crore in FY26.
- CleanMax had 3,638 MW of operational renewable-energy power-sales capacity at September 30, 2026, up from 3,088 MW on March 31, 2026.
- CleanMax targets minimum FY27 commissioning of 1,500 MW after adding 550 MW in H1 FY27.
- CleanMax’s 2,632 MW under-execution power-sales portfolio had a Rs 3.98 per kilowatt-hour weighted-average tariff.
powered by IRIS
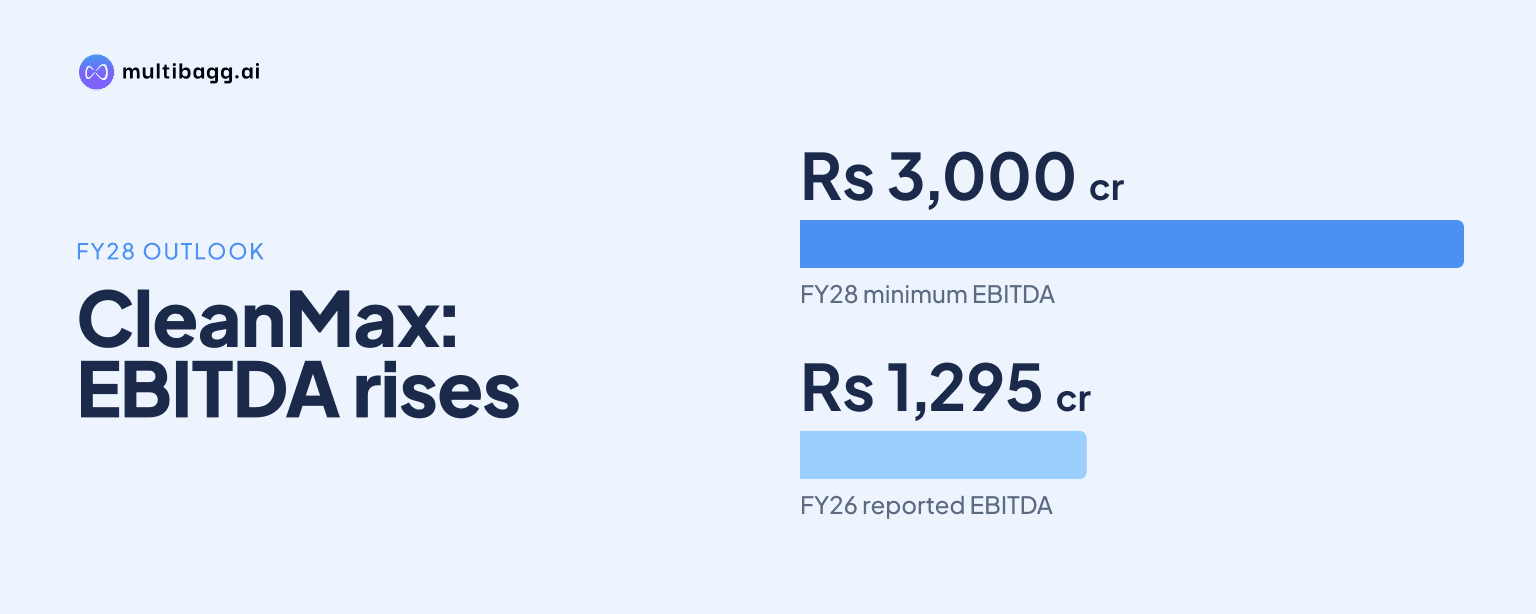
Clean Max Enviro Energy Solutions Limited targets minimum FY28 reported EBITDA of Rs 3,000 crore, based on at least 4.6 gigawatts (GW) of operational renewable-energy power-sales capacity as of April 1, 2027. The guidance follows 3,638 megawatts (MW), or about 3.6 GW, of operational capacity at September 30, 2026.
Know Clean Max Enviro Energy Solutions inside out
Results, valuation, peers and who's buying, in one view.
How will CleanMax reach 4.6 GW of operating capacity?
CleanMax plans to reach at least 4.6 GW by commissioning a minimum 1,500 MW of renewable-energy power-sales capacity in FY27. Its illustrative assumptions start FY27 with 3,088 MW, add at least 1,500 MW, and arrive at at least 4,588 MW at year-end. The FY28 guidance page describes the 4.6 GW capacity base as of April 1, 2027.
The operating base had already increased by 550 MW in H1 FY27, from 3,088 MW on March 31, 2026 to 3,638 MW on September 30, 2026. The presentation also describes the H1 addition as 0.6 GW, while its state-level table totals 549 MW. CleanMax reported approximately 57% trailing-12-month growth in operational renewable-energy power-sales capacity at September 30, 2026.
CleanMax had 2,632 MW of contracted yet-to-be-executed power-sales capacity on September 30, 2026, providing the project pipeline for the FY27 plan. The company defines this category as projects with a signed power purchase agreement (PPA) or letter of intent for which commissioning remains under way. The FY27 minimum of 1,500 MW is higher than the 1,376 MW addition disclosed for FY26.
What is CleanMax’s FY28 EBITDA target?
CleanMax has guided for minimum reported EBITDA of Rs 3,000 crore in FY28, which management says represents 2.3 times FY26 reported EBITDA of Rs 1,295 crore. EBITDA means earnings before interest, tax, depreciation and amortisation. This is management guidance contingent on its capacity and commissioning assumptions, not a reported financial result.
CleanMax defines FY28 reported EBITDA as the contribution from full-year run-rate assets plus partial-year ramp-up from newly commissioned assets. Management says reported EBITDA has averaged about 1.1 times the preceding year’s run-rate EBITDA, while adding that the FY28 number could rise as commissioning progresses and new assets contribute for more of the year. Its disclosed steady-state net debt figure alongside the FY28 guidance is Rs 16,000 crore.
The guidance differs from the adjusted EBITDA reported for H1 FY27. CleanMax reported adjusted EBITDA of Rs 1,047.2 crore in H1 FY27, up 56% from Rs 670.1 crore in H1 FY26, and Rs 553.1 crore in Q2 FY27, up 43% year on year. The presentation says a bridge from reported to adjusted EBITDA is available in its detailed financial-results section, but it does not provide that bridge on the guidance page.
What unit economics underpin CleanMax’s capacity plan?
CleanMax’s disclosed unit economics show solar capital expenditure of Rs 3.5 crore per megawatt-peak (MWp) and wind capital expenditure of Rs 7.8 crore per MW. MWp is the direct-current rating used for solar capacity. The company says these figures exclude soft costs, which it estimates at about 5% to 7% of total capital expenditure.
CleanMax indicates EBITDA of Rs 50 lakh to Rs 55 lakh per MWp for solar and Rs 1 crore to Rs 1.1 crore per MW for wind. Its solar generation assumption uses P75 plant load factor (PLF), while wind uses P90 PLF, referring to different probability levels for expected generation. The company’s portfolio-level EBITDA margin range is 83% to 84%, with net debt at 5.0 to 5.5 times run-rate EBITDA.
The company says a typical new capacity mix is 70% solar and 30% wind. By contrast, its contracted portfolio at September 30, 2026 was 59% solar and 41% wind, meaning the disclosed contracted mix had a 11-percentage-point higher wind share than the typical mix. CleanMax’s portfolio total, which includes renewable-energy services and evacuation categories, rose to 13,199 MW from 11,788 MW on March 31, 2026.
Got a follow-up? Ask IRIS
How are CleanMax’s tariffs and segment results changing?
CleanMax reported a weighted-average tariff of Rs 3.91 per kilowatt-hour for its 3.6 GW operational portfolio and Rs 3.98 per kilowatt-hour for 2.6 GW under execution. The under-execution portfolio therefore carried a stated average tariff Rs 0.07 per kilowatt-hour above the operational base at September 30, 2026.
In H1 FY27, renewable-energy power sales revenue increased to Rs 1,132.3 crore from Rs 719.2 crore in H1 FY26, while adjusted EBITDA rose to Rs 986.1 crore from Rs 617.9 crore. The segment’s EBITDA margin increased to 84.0% from 82.6%. Renewable-energy services revenue rose to Rs 423.8 crore from Rs 205 crore, but its EBITDA margin declined to 14.3% from 25.4%.
Total revenue from operations reached Rs 1,559.8 crore in H1 FY27, up 67% from Rs 933 crore a year earlier. The power-sales segment accounted for Rs 1,132.3 crore of that revenue, compared with Rs 423.8 crore from renewable-energy services. This segment split matters because the FY28 capacity target is specifically tied to operational renewable-energy power-sales assets.
Which execution factors can affect FY28 reported EBITDA?
CleanMax identifies project commissioning timing and post-commissioning ramp-up as factors affecting FY28 reported EBITDA. State transmission utility (STU) projects typically require three to six months after commissioning to stabilise because of open-access and regulatory approvals. That interval can reduce the portion of a fiscal year in which a newly commissioned asset contributes.
Central transmission utility (CTU) projects face a separate grid-evacuation consideration. CleanMax says initial grid-evacuation availability for its Bikaner-II CTU project will have a limited effect on ramp-up. At September 30, 2026, the company had received evacuation for 3,263 MW and had applied for evacuation for 2,836 MW, versus 3,632 MW received and 1,700 MW applied for on March 31, 2026.
The project base also includes 606 commercial and industrial customers across 10 states, with a weighted-average PPA tenor of 23 years. Repeat business represented 85% of new PPAs in the current period, compared with 74% in FY26. These contracts support the 2,632 MW under-execution pipeline, but management’s Rs 3,000 crore FY28 target still depends on project delivery and ramp-up timing.
Conclusion
CleanMax’s FY28 target links a minimum 4.6 GW operating-capacity base on April 1, 2027 with minimum reported EBITDA of Rs 3,000 crore, compared with Rs 1,295 crore in FY26. The underlying operating base was 3,638 MW at September 30, 2026, while the contracted but unexecuted power-sales pipeline was 2,632 MW.
The next disclosed milestone is minimum FY27 commissioning of 1,500 MW, after 550 MW was added in H1 FY27. The key items to watch are commissioning progress, the three-to-six-month STU stabilisation process, CTU grid-evacuation availability and the amount of FY28 contribution from newly commissioned projects, all of which management says can affect reported EBITDA.