










Ddev PAT rose more than ninefold as XLPE reached 72% volume
Key highlights
- Ddev’s PAT rose from Rs 21 crore in FY21 to Rs 202 crore in FY26.
- XLPE increased from 55% of Ddev’s production volume in FY21 to 72% in FY26.
- Ddev’s EBITDA margin increased from 5% in FY21 to 11% in FY26.
- Ddev reported installed capacity of 3,16,400 MT as of September 2026.
powered by IRIS
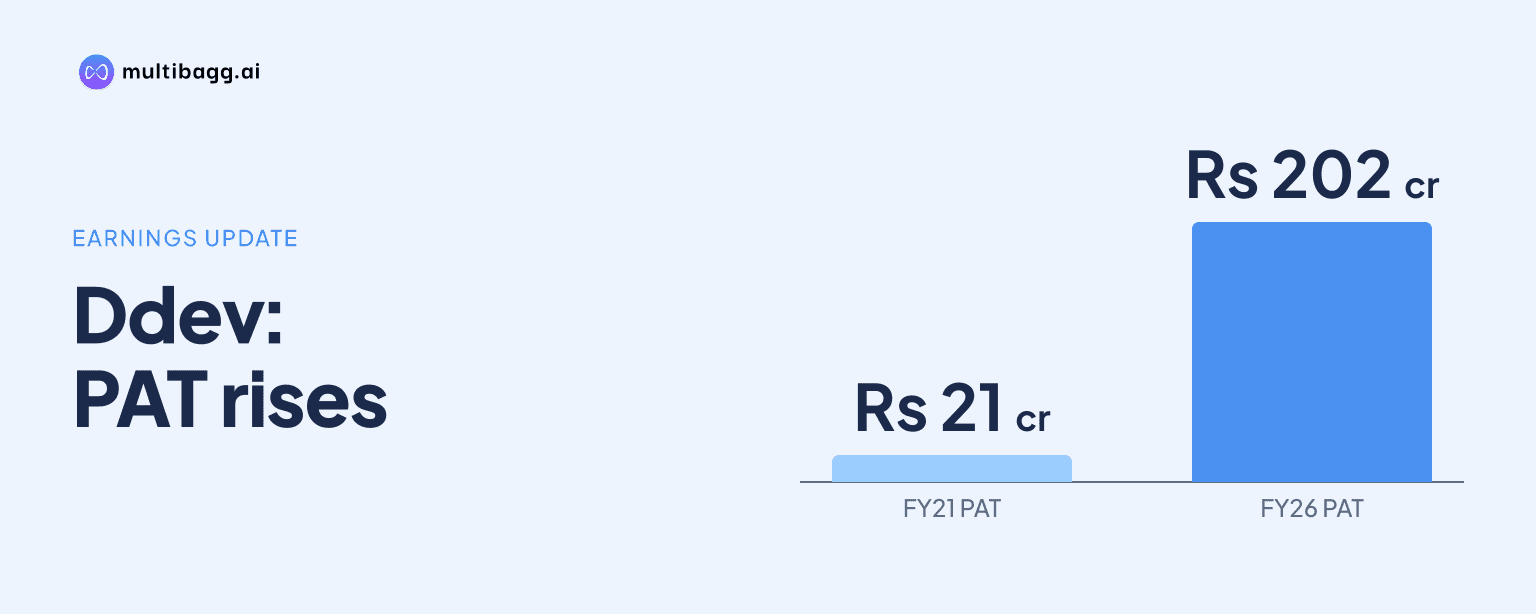
Ddev Plastiks Ltd reported PAT of Rs 202 crore in FY26, more than nine times its Rs 21 crore FY21 result, while XLPE represented 72% of production volume against 55% in FY21. Management attributes its margin improvement to a move towards more value-added, high-growth products.
Know DDev Plastiks Industries inside out
Results, valuation, peers and who's buying, in one view.
How much did Ddev’s profit grow between FY21 and FY26?
Ddev’s PAT increased by Rs 181 crore, from Rs 21 crore in FY21 to Rs 202 crore in FY26, while net revenue rose by Rs 1,414 crore to Rs 2,948 crore. The presentation reports a 58% compound annual growth rate, or CAGR, for PAT over FY21-FY26, compared with 14% for net revenue, meaning reported profit grew faster than sales.
Earnings before interest, tax, depreciation and amortisation, or EBITDA, rose from Rs 74 crore in FY21 to Rs 320 crore in FY26. EBITDA margin increased from 5% to 11%, while PAT margin rose from 1% to 7%; Ddev notes that EBITDA and its margin include other income.
The FY23-to-FY24 comparison shows the difference between revenue and earnings movements. Revenue declined by Rs 73 crore to Rs 2,431 crore in FY24, yet EBITDA rose by Rs 96 crore to Rs 282 crore and PAT increased by Rs 78 crore to Rs 182 crore; EBITDA margin consequently rose from 7% to 12%.
In 1HFY27, Ddev reported net revenue of Rs 1,968 crore, EBITDA of Rs 187 crore and PAT of Rs 116 crore. These are six-month figures, rather than full-year figures comparable with FY26, and the reported EBITDA and PAT margins were 10% and 6%, respectively.
How did XLPE change Ddev’s production mix?
Ddev increased XLPE’s share of production volume from 55% in FY21 to 72% in FY26, making XLPE its largest disclosed product category in both years. The share reached 73% in FY25 before declining by one percentage point in FY26, and it was 71% in 1HFY27.
Reported production volume rose from 1,24,094 metric tonnes, or MT, in FY21 to 1,89,374 MT in FY25. Ddev does not disclose an FY26 production-volume total, so the FY26 product shares cannot be converted to tonnage from the supplied presentation.
The mix change also reduced Antifab’s representation. Antifab declined from 22% of volume in FY21 to 10% in FY25 and 8% in FY26, while PVC compounds increased from 15% in FY25 to 17% in FY26; engineering products accounted for 0.40% and high flame-retardant, or HFFR, products for 2% in FY26.
Got a follow-up? Ask IRIS
What changed in Ddev’s margins and per-ton economics?
Ddev’s gross margin increased from 13% in FY21 to 18% in FY26, while EBITDA margin rose from 5% to 11% and PAT margin from 1% to 7%. Gross margin was highest in the disclosed period at 20% in FY24, when EBITDA margin was 12% and PAT margin was 7%.
EBITDA per ton increased from Rs 5,819 in FY21 to Rs 15,905 in FY26, while revenue per ton rose from Rs 1,19,980 to Rs 1,45,136. In Q2FY27, Ddev reported revenue per ton of Rs 1,92,626 and EBITDA per ton of Rs 16,978.
Per-ton revenue and EBITDA did not move together in every year. Revenue per ton declined from Rs 1,74,344 in FY23 to Rs 1,45,556 in FY24, while EBITDA per ton increased from Rs 12,931 to Rs 16,878, alongside the rise in EBITDA margin from 7% to 12%.
Ddev’s earnings per share rose from Rs 2.25 in FY21 to Rs 19.5 in FY26. Return on capital employed, or ROCE, was 30% in FY26 after 41% in FY24, and return on equity, or ROE, was 20% in FY26 after 28% in FY24; Ddev defines ROCE as earnings before interest and tax divided by capital employed and ROE as PAT divided by total equity.
What capacity and product plans has Ddev disclosed?
Ddev reported installed capacity of 3,16,400 MT as of September 2026 across six manufacturing plants in Rajasthan, West Bengal, Daman and Diu, and Dadra and Nagar Haveli. Its Surangi plant has 92,600 MT of Sioplas capacity and 35,000 MT of peroxide capacity, while Silvassa Dadra Plant 1 has 58,000 MT of PVC compounds capacity.
Ddev said it installed new PVC and HFFR capacities, and commissioned an XLPE compounds facility in Rajasthan in April 2026. The company stated that output from the Rajasthan XLPE facility will be recorded from 1QFY27 onwards, and it plans brownfield expansion at existing facilities in stages over the next three years.
The product programme includes polyethylene compounds for 66-72 kilovolt, or KV, cables and production of polyethylene compounds for 132 KV cables. Ddev stated that its next focus is compounds for applications up to 220 KV, and it also received third-party approval for locally produced water tree retardant XLPE insulation compounds.
Net worth rose from Rs 337 crore in FY21 to Rs 1,013 crore in FY26. Ddev said it became net debt-free in 4QFY24 and is committed to maintaining that status through FY27 and beyond; net debt-to-equity and net debt-to-EBITDA were both reported at 0.0 times in FY26.
Conclusion
Ddev’s FY21-FY26 record shows that PAT increased from Rs 21 crore to Rs 202 crore as XLPE grew from 55% to 72% of reported production mix and EBITDA margin rose from 5% to 11%. The FY24 result, when EBITDA and PAT rose despite a Rs 73 crore fall in revenue, aligns with management’s explanation that value-added product mix and realisations contributed to margins.
The next disclosed markers are the contribution from the Rajasthan XLPE facility, which Ddev said will be recorded from 1QFY27, and the brownfield expansion programme planned over the next three years. Management has also set an FY30 net-revenue target of Rs 5,000 crore and identified a next product focus of cable compounds for applications up to 220 KV.