










Deep Industries H1 revenue rose 36.6% as margins narrowed
Key highlights
- Deep Industries’ H1 FY27 revenue rose 36.6% to Rs 574.34 crore from Rs 420.51 crore.
- H1 FY27 EBITDA rose 23.1% to Rs 255.83 crore, implying a 44.5% margin versus 49.4% in H1 FY26.
- Deep Industries reported H1 FY27 cash flows of Rs 154.72 crore, up 35.4% from Rs 114.29 crore.
- Deep Industries’ closing running order book was about Rs 3,089 crore on 30 September 2026.
powered by IRIS
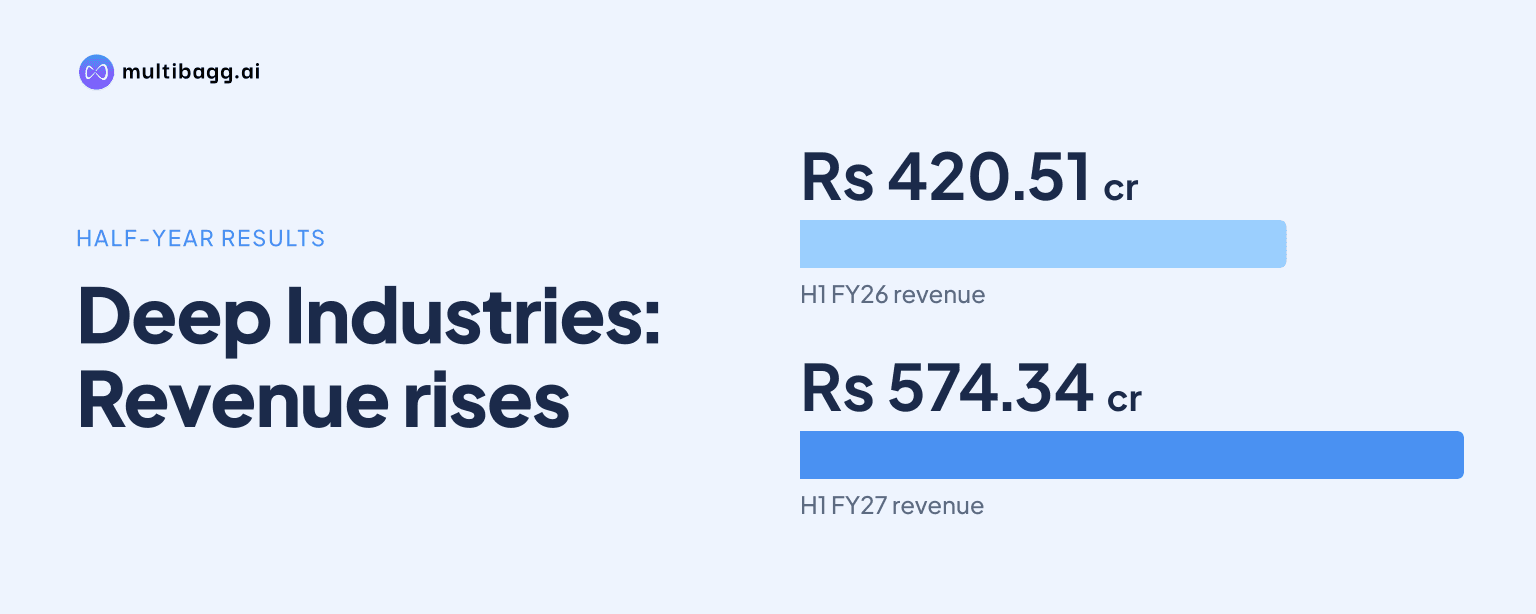
Deep Industries Limited reported consolidated H1 FY27 revenue of Rs 574.34 crore, up 36.6% from Rs 420.51 crore a year earlier, while its calculated EBITDA margin declined to 44.5% from 49.4%. EBITDA rose 23.1% to Rs 255.83 crore, meaning it grew more slowly than revenue during the first half.
What did Deep Industries report in H1 FY27?
Deep Industries reported revenue growth of 36.6% in H1 FY27, with revenue increasing by Rs 153.83 crore from Rs 420.51 crore in H1 FY26 to Rs 574.34 crore. The presentation describes the consolidated H1 FY27 performance as its highest-ever growth across the key parameters it reported and states that figures are rounded to the nearest decimal place.
Know Deep Industries inside out
Results, valuation, peers and who's buying, in one view.
EBITDA, or earnings before interest, tax, depreciation and amortisation, increased 23.1% to Rs 255.83 crore from Rs 207.88 crore. Profit after tax, or PAT, rose 28.2% to Rs 170.37 crore from Rs 132.93 crore, while Cash PAT increased 31.5% to Rs 219.93 crore from Rs 167.23 crore. Revenue therefore expanded faster than all three reported earnings measures.
The Q2 FY27 comparison also showed revenue growing faster than EBITDA. Q2 revenue rose 33.7% to Rs 295.43 crore from Rs 221.01 crore in Q2 FY26, whereas EBITDA increased 9.9% to Rs 124 crore from Rs 112.86 crore. Q2 PAT rose 14.0% to Rs 81.22 crore and Cash PAT increased 19.5% to Rs 106.53 crore.
How much did Deep Industries’ EBITDA margin change?
Deep Industries’ reported revenue and EBITDA figures imply an H1 FY27 EBITDA margin of 44.5%, compared with 49.4% in H1 FY26, a decline of 4.9 percentage points. This is a calculation from the presentation’s consolidated amounts, rather than a margin figure separately reported by Deep Industries.
The change follows a Rs 47.95 crore rise in EBITDA against a Rs 153.83 crore increase in revenue. The difference between revenue and EBITDA was Rs 318.51 crore in H1 FY27, compared with Rs 212.63 crore in H1 FY26. The supplied presentation does not provide expense-line categories or a management explanation for the H1 margin movement.
Q2 implied margins narrowed more than the first-half measure. EBITDA of Rs 124 crore on Q2 FY27 revenue of Rs 295.43 crore implies a 42.0% margin, versus 51.1% from EBITDA of Rs 112.86 crore and revenue of Rs 221.01 crore in Q2 FY26. Deep Industries did not reconcile this change to individual operating-cost items in the presentation.
What do Deep Industries’ cash flow and balance-sheet figures show?
Deep Industries reported cash flows, also labelled free cash flow in its key-ratios page, of Rs 154.72 crore in H1 FY27, up 35.4% from Rs 114.29 crore in H1 FY26. The company described this as its highest-ever free cash flow from operations, while the underlying table labels the measure as cash flows.
Asset size increased 9.6% to Rs 2,844 crore in H1 FY27 from Rs 2,595 crore in FY26, and net worth rose 7.5% to Rs 2,149 crore from Rs 1,999 crore. Total debt was Rs 232.94 crore as of 30 September 2026, while debt to equity was 0.13 times in H1 FY27.
The presentation’s working-capital measure showed receivables days falling to 99 in FY27 from 131 in FY26, a reduction of 32 days. Deep Industries said this represented a 25% decline, and noted that the measure excludes legacy receivables from the Dolphin group. Debt to EBITDA was 0.46 times in FY27 versus 0.48 times in FY26, while return on equity was 19.3% versus 21.9% and return on capital employed was 21.6% versus 19.3%.
Got a follow-up? Ask IRIS
What does Deep Industries’ order book indicate about activity?
Deep Industries’ consolidated closing running order book was about Rs 3,089 crore on 30 September 2026, compared with about Rs 3,047 crore on 1 July 2026. It added Rs 337 crore of orders during the quarter and executed Rs 295 crore, resulting in an approximate Rs 42 crore increase. The order-book figures exclude goods and services tax.
The Rs 295 crore executed during the July-to-September 2026 quarter was close to Q2 FY27 revenue of Rs 295.43 crore. However, the presentation does not state that the executed order-book amount is identical to reported revenue, nor does it provide a contract-level or service-line reconciliation between the two figures.
Management said its outlook includes a revolving order book of more than Rs 3,000 crore and a bidding pipeline. It also said it is exploring higher-capacity onshore drilling rigs under integrated project management, citing demand for onshore drilling rigs, workover and production services, and integrated field services during the FY26 to FY30 exploration outlook. Through Dolphin, management also cited opportunities for additional long-term offshore charter-hire contracts.
Conclusion
Deep Industries delivered higher H1 FY27 revenue, EBITDA, PAT, Cash PAT and reported cash flows, with revenue increasing 36.6% to Rs 574.34 crore and free cash flow increasing 35.4% to Rs 154.72 crore. The same figures show EBITDA growing more slowly than revenue, producing a calculated 4.9-percentage-point decline in the H1 EBITDA margin, while the Q2 implied margin was 42.0%.
The next disclosures to watch are progress on management’s exploration of higher-capacity onshore drilling rigs and potential long-term Dolphin charter contracts. Order additions and execution against the Rs 3,089 crore closing order book, as well as receivables days after the reported decline to 99, will show how the stated pipeline converts into activity and cash flow.