










Devson Catalyst Ltd debt-to-equity falls to 0.07x in FY26
Key highlights
- Devson Catalyst reported FY26 debt-to-equity of 0.07x, down from 0.33x in FY24.
- Devson Catalyst’s ROCE rose to 47.60% in FY26 from 36.67% in FY24.
- FY26 net profit reached Rs 12.5209 crore, compared with Rs 7.6723 crore in FY25.
- FY26 inventories and trade receivables were Rs 7.7477 crore and Rs 16.7532 crore, respectively.
powered by IRIS
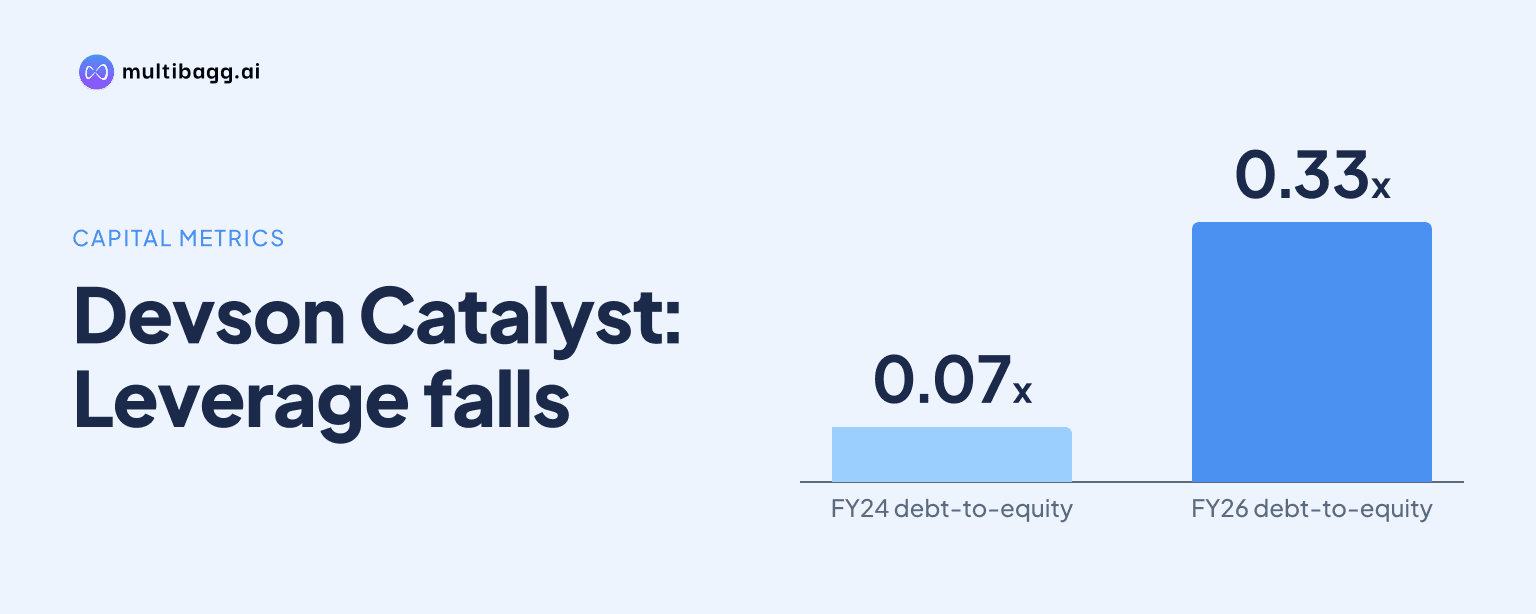
Devson Catalyst Ltd reported debt-to-equity of 0.07x in FY26, down from 0.33x in FY24, while return on capital employed, or ROCE, rose to 47.60% from 36.67%. The FY26 outcome coincided with shareholders’ equity reaching Rs 33.4982 crore and net profit increasing to Rs 12.5209 crore, although inventories and receivables also grew.
Know Devson Catalyst inside out
Results, valuation, peers and who's buying, in one view.
How did Devson Catalyst reduce debt-to-equity in FY26?
Devson Catalyst reported debt-to-equity of 0.07x in FY26, compared with 0.13x in FY25 and 0.33x in FY24. The ratio declined as total borrowings, calculated from current and non-current borrowing lines, fell to Rs 2.5011 crore in FY26 from Rs 2.7846 crore in FY25 and Rs 4.3538 crore in FY24, while shareholders’ equity increased.
Total shareholders’ equity rose to Rs 33.4982 crore in FY26 from Rs 20.9773 crore in FY25 and Rs 13.305 crore in FY24. Equity share capital increased to Rs 10.25 crore from Rs 0.25 crore, while other equity reached Rs 23.2482 crore from Rs 20.7273 crore. Non-current borrowings increased to Rs 0.8925 crore from Rs 0.0887 crore, but current borrowings declined to Rs 1.6086 crore from Rs 2.6959 crore.
What supported Devson Catalyst’s higher return ratios?
Devson Catalyst reported ROCE of 47.60% in FY26, up from 44.71% in FY25 and 36.67% in FY24. Return on equity, or ROE, increased to 45.97% in FY26 from 44.76% in FY25 and 36.20% in FY24. Management described the ROCE progression as improving capital efficiency and linked rising ROE to profitability relative to shareholders’ capital.
Profit growth outpaced revenue growth from FY24 to FY26. Revenue from operations rose to Rs 55.7759 crore in FY26 from Rs 43.4699 crore in FY24, while earnings before interest, tax, depreciation and amortisation, or EBITDA, grew to Rs 16.7646 crore from Rs 6.6908 crore. Net profit increased to Rs 12.5209 crore from Rs 4.0784 crore. The presentation characterises the respective FY24-to-FY26 changes as growth of 1.3 times, 2.5 times and 3.1 times.
FY26 EBITDA margin was 29.49%, versus 20.42% in FY25 and 15.29% in FY24, while net profit margin reached 22.45%, compared with 14.42% and 9.38%. Finance costs were Rs 0.4408 crore in FY26, up from Rs 0.3787 crore in FY25 but below Rs 0.8994 crore in FY24. The return-ratio rise therefore occurred alongside higher operating and net margins, despite the larger FY26 equity base.
Got a follow-up? Ask IRIS
What changed in Devson Catalyst’s working capital and assets?
Devson Catalyst’s current assets rose to Rs 28.6404 crore in FY26 from Rs 19.3916 crore in FY25, led by inventory and trade receivables. Inventories increased to Rs 7.7477 crore from Rs 2.7717 crore, while trade receivables rose to Rs 16.7532 crore from Rs 12.6656 crore. Together, the two balances totalled Rs 24.5009 crore in FY26, compared with Rs 15.4373 crore a year earlier.
Property, plant and equipment increased to Rs 11.7051 crore in FY26 from Rs 6.7748 crore in FY25, and total non-current assets reached Rs 12.9872 crore from Rs 7.9849 crore. Total assets rose to Rs 41.6276 crore from Rs 27.3765 crore. The presentation does not state the operational reason for the inventory, receivable or property, plant and equipment movements.
Current liabilities increased to Rs 6.8571 crore in FY26 from Rs 5.9421 crore in FY25. Trade payables to parties other than micro, small and medium enterprises, or MSMEs, rose to Rs 1.8952 crore from Rs 0.8947 crore, while provisions and current tax liabilities increased to Rs 1.0728 crore from Rs 0.1426 crore. Current assets exceeded current liabilities in each reported year, but the presentation provides no collection-period or working-capital-cycle metric.
Did Devson Catalyst’s cash flow track FY26 profit growth?
Devson Catalyst generated net cash flow from operating activities of Rs 4.5564 crore in FY26, marginally above Rs 4.5008 crore in FY25 and higher than Rs 0.2077 crore in FY24. FY26 operating cash flow was below FY26 net profit of Rs 12.5209 crore. The cash-flow statement does not provide an itemised reconciliation of working-capital changes, while the balance sheet shows higher inventories and trade receivables.
Net cash used in investing activities was Rs 2.949 crore in FY26, compared with Rs 2.4743 crore in FY25 and Rs 2.6144 crore in FY24. Financing activities used Rs 0.7062 crore in FY26, after an outflow of Rs 1.9219 crore in FY25 and an inflow of Rs 2.6236 crore in FY24. The combined movement increased cash and cash equivalents by Rs 0.9012 crore to Rs 2.165 crore at the FY26 end.
Loans and advances rose to Rs 1.1895 crore in FY26 from Rs 0.3772 crore in FY25, while other current assets increased to Rs 0.785 crore from Rs 0.2734 crore. Current investments of Rs 2.0399 crore were shown in FY25 but not in FY26. These disclosed balance-sheet movements provide context for cash increasing in FY26 even as reported profit rose by Rs 4.8486 crore from FY25.
Conclusion
Devson Catalyst’s FY26 figures show a lower debt-to-equity ratio of 0.07x, higher ROCE of 47.60% and higher ROE of 45.97%. Revenue increased by Rs 2.5838 crore from FY25, whereas EBITDA increased by Rs 5.8292 crore and net profit by Rs 4.8486 crore. At the same time, the company had a larger equity base, lower total borrowings than FY24, and substantially higher inventory and receivable balances.
What to watch next is whether operating cash flow develops relative to FY26 inventory of Rs 7.7477 crore and trade receivables of Rs 16.7532 crore, as well as the effect of the Rs 4.9303 crore increase in property, plant and equipment. For H1 FY27, Devson Catalyst reported revenue from operations of Rs 31.6878 crore, EBITDA of Rs 9.7162 crore and profit after tax of Rs 7.5036 crore, against Rs 31.332 crore, Rs 8.8225 crore and Rs 6.6333 crore in H1 FY26.