










Devson H1 FY27 net profit rises 13% as EBITDA margin expands
Key highlights
- Devson reported H1 FY27 PAT of Rs 7.50 crore, up 13.12% year on year.
- H1 FY27 revenue from operations increased 1.14% to Rs 31.69 crore.
- H1 FY27 EBITDA margin rose 250 basis points to 30.66%.
- FY26 EBITDA margin was 29.49%, compared with 15.29% in FY24.
powered by IRIS
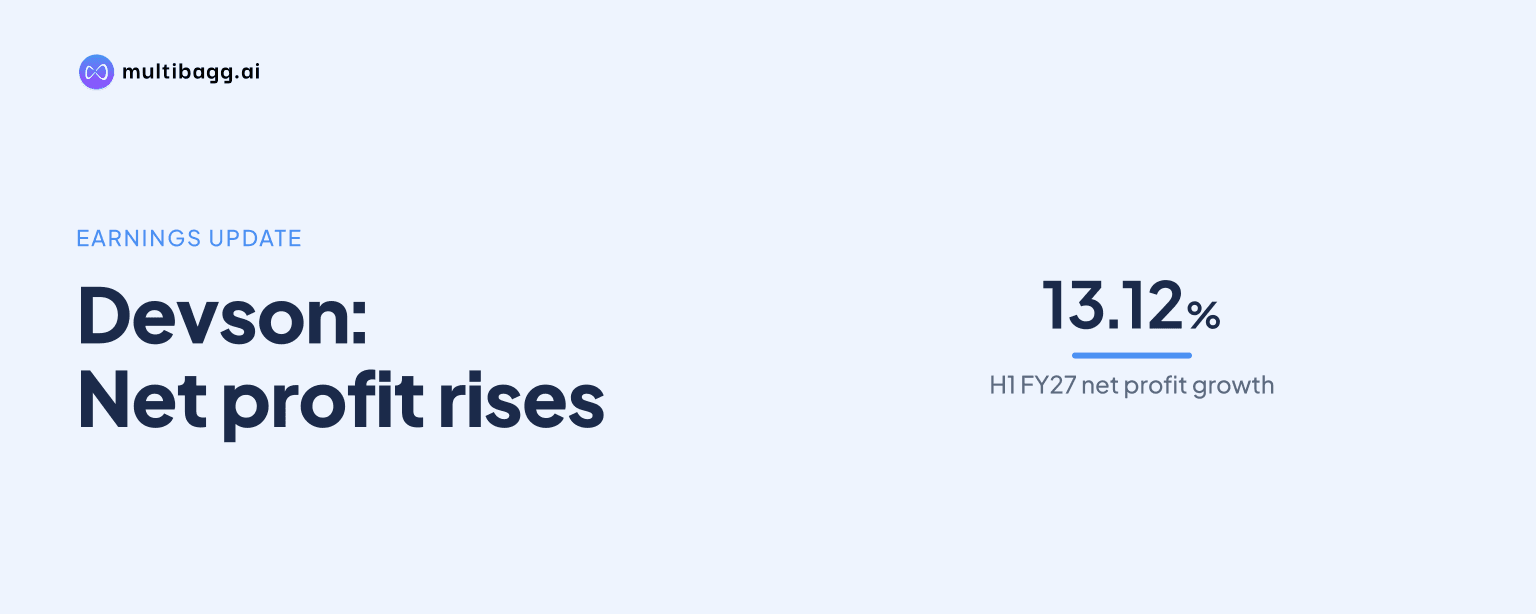
Devson Catalyst reported net profit of Rs 7.50 crore in the first half (H1) of fiscal year (FY) 2027, up 13.12% year on year, as its EBITDA margin expanded by 250 basis points to 30.66% despite revenue from operations growing 1.14% to Rs 31.69 crore.
Know Devson Catalyst inside out
Results, valuation, peers and who's buying, in one view.
How did Devson perform in H1 FY27?
Devson increased operating and net earnings faster than sales in H1 FY27. Revenue from operations rose from Rs 31.33 crore in H1 FY26 to Rs 31.69 crore, while earnings before interest, tax, depreciation and amortisation (EBITDA) increased 10.13% from Rs 8.82 crore to Rs 9.72 crore. The gap between the 1.14% revenue increase and the 10.13% EBITDA increase was reflected in the higher operating margin.
Profit after tax (PAT) rose 13.12% to Rs 7.50 crore from Rs 6.63 crore in the prior-year half, while profit before tax increased 10.1% to Rs 9.27 crore. Current tax expense rose 1.3% to Rs 2.23 crore, depreciation and amortisation increased to Rs 32.61 lakh from Rs 25.44 lakh, and finance cost fell to Rs 11.82 lakh from Rs 17.55 lakh.
What drove Devson’s H1 FY27 margin expansion?
Devson’s margin expansion followed a decline in total expenses while total income edged higher. Total expenses decreased to Rs 21.97 crore in H1 FY27 from Rs 22.51 crore in H1 FY26, while total income increased 1.19% to Rs 32.22 crore from Rs 31.84 crore. That combination increased EBITDA by Rs 89.37 lakh.
Other expenses recorded the largest disclosed reduction, falling by Rs 95.82 lakh to Rs 3.33 crore from Rs 4.28 crore. The inventory-change line was negative Rs 1.54 crore, compared with negative Rs 32.43 lakh a year earlier. These movements offset a Rs 1.56 crore increase in cost of materials consumed to Rs 16.08 crore and a Rs 4.76 lakh increase in employee benefit expense to Rs 2.17 crore.
EBITDA margin rose to 30.66% from 28.16%, an increase of 250 basis points, with 100 basis points equal to one percentage point. PAT margin rose 251 basis points to 23.68% from 21.17%. The Rs 5.73 lakh decline in finance cost also contributed below EBITDA, while other income increased by Rs 2.39 lakh to Rs 53.09 lakh.
How does H1 FY27 compare with Devson’s annual financial trend?
Devson’s H1 FY27 result followed a FY24-to-FY26 period in which profit grew faster than revenue. Revenue from operations rose from Rs 43.47 crore in FY24 to Rs 55.78 crore in FY26, while EBITDA increased from Rs 6.69 crore to Rs 16.76 crore and PAT rose from Rs 4.08 crore to Rs 12.52 crore. The presentation describes the three-year change as 1.3 times for revenue, 2.5 times for EBITDA and 3.1 times for PAT.
Revenue growth slowed in FY26 compared with FY25, but annual profitability continued to rise. Revenue increased by Rs 2.58 crore in FY26 from Rs 53.19 crore in FY25, after a Rs 9.72 crore increase in FY25 from FY24. EBITDA increased by Rs 5.83 crore in FY26, compared with a Rs 4.24 crore increase in FY25, while PAT increased by Rs 4.85 crore after a Rs 3.59 crore rise in the preceding year.
Got a follow-up? Ask IRIS
Which annual cost movements accompanied Devson’s profit growth?
Devson’s EBITDA margin reached 29.49% in FY26, versus 20.42% in FY25 and 15.29% in FY24. The FY26 margin was 907 basis points above FY24, while PAT margin increased to 22.45% from 14.42% in FY25 and 9.38% in FY24. These annual movements preceded the 30.66% EBITDA margin reported in H1 FY27.
Total expenses fell to Rs 39.01 crore in FY26 from Rs 42.26 crore in FY25 even as revenue from operations increased by Rs 2.58 crore. Purchases of stock-in-trade declined to Rs 2.48 crore from Rs 8.36 crore, and the inventory-change line moved to negative Rs 4.83 crore from negative Rs 67.48 lakh. Cost of materials consumed rose to Rs 29.52 crore from Rs 25.28 crore, while other expenses rose to Rs 7.50 crore from Rs 5.44 crore.
Finance costs were Rs 44.08 lakh in FY26, compared with Rs 37.87 lakh in FY25 and Rs 89.94 lakh in FY24. Depreciation and amortisation was Rs 56.04 lakh in FY26, up from Rs 52.03 lakh in FY25. Total tax expense increased to Rs 4.31 crore from Rs 2.71 crore, while PAT nevertheless rose 63.2% from Rs 7.67 crore to Rs 12.52 crore.
What does Devson’s H1 FY27 result show about sales and earnings?
Devson’s H1 FY27 figures show that the increase in earnings came principally from lower expenses and wider margins rather than material sales growth. Revenue added Rs 35.58 lakh year on year, compared with EBITDA growth of Rs 89.37 lakh and PAT growth of Rs 87.03 lakh. Revenue growth was 1.14%, against EBITDA growth of 10.13% and PAT growth of 13.12%.
The H1 FY27 income statement included other income of Rs 53.09 lakh, compared with Rs 50.70 lakh in H1 FY26. That Rs 2.39 lakh increase was smaller than the Rs 37.97 lakh increase in total income and the Rs 53.79 lakh reduction in total expenses. On the figures presented, the reduction in other expenses was the largest disclosed expense movement supporting EBITDA growth.
Conclusion
Devson’s H1 FY27 profit growth outpaced its sales growth because EBITDA margin rose to 30.66% and PAT margin reached 23.68%. The half-year performance extends the FY24-to-FY26 pattern, in which EBITDA rose from Rs 6.69 crore to Rs 16.76 crore while revenue increased from Rs 43.47 crore to Rs 55.78 crore.
The presentation does not disclose a forward revenue target, margin target, operating plan or scheduled milestone. The next reported revenue, other-expense and inventory-change figures will therefore show whether the H1 FY27 pattern of 1.14% sales growth and a 250-basis-point EBITDA-margin increase continued.