










Dhampur cuts net debt-to-EBITDA to 0.90 at September 2026
Key highlights
- Dhampur's net debt-to-EBITDA fell to 0.90 at 30 September 2026 from 3.13 at 31 March 2026.
- Short-term debt declined by Rs 462.88 crore to Rs 171.38 crore in the six months to 30 September 2026.
- Cash and liquid investments increased to Rs 334.27 crore at 30 September 2026 from Rs 267.25 crore at 31 March 2026.
- H1 FY27 EBITDA rose to Rs 82.97 crore from Rs 41.09 crore in H1 FY26.
powered by IRIS
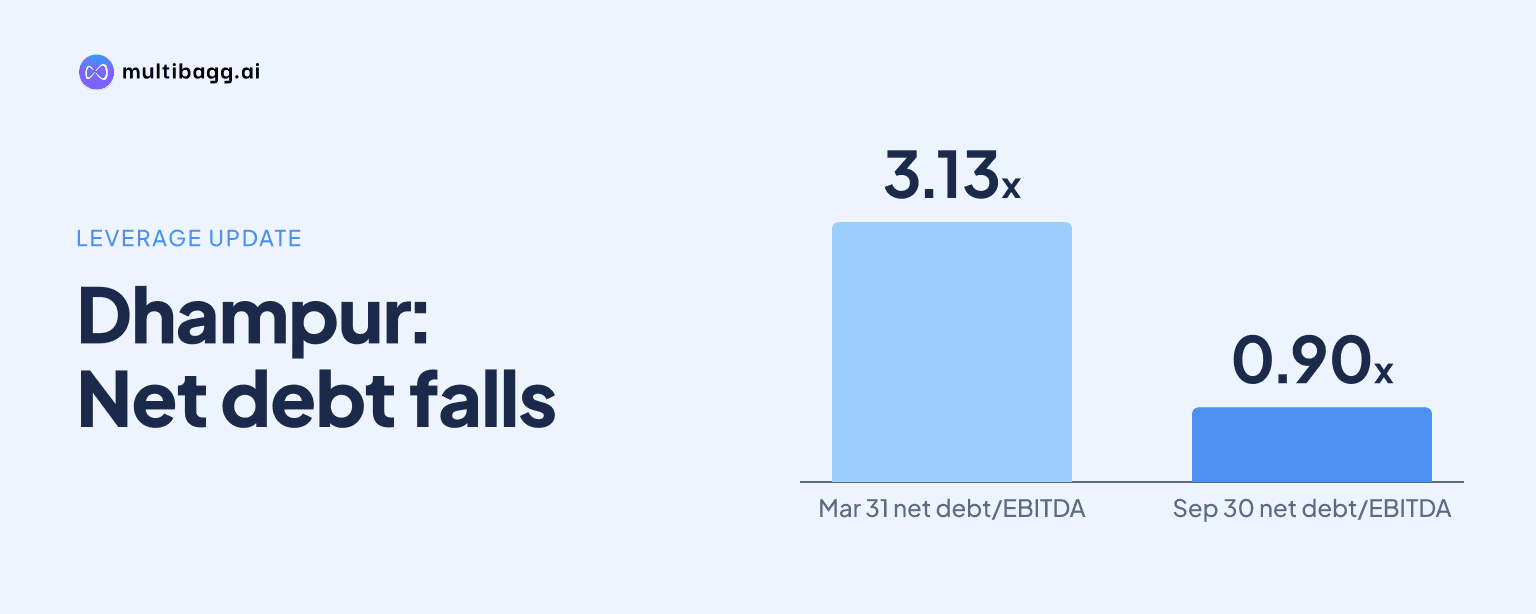
Dhampur Sugar reported net debt-to-EBITDA of 0.90 at 30 September 2026, down from 3.13 at 31 March 2026, after short-term debt fell Rs 462.88 crore to Rs 171.38 crore and cash and liquid investments increased to Rs 334.27 crore. H1 FY27 EBITDA was Rs 82.97 crore.
Know Dhampur Sugar Mills inside out
Results, valuation, peers and who's buying, in one view.
How did Dhampur's leverage change by September 2026?
Dhampur's reported net debt-to-EBITDA ratio declined to 0.90 at 30 September 2026 from 3.13 at 31 March 2026 and 5.95 at 30 September 2025. Its debt-to-equity ratio also moved to 0.34, compared with 0.74 in March 2026 and 0.43 a year earlier, according to the presentation's key-ratios page.
The movement coincided with lower debt balances and slightly higher equity. Short-term debt was Rs 171.38 crore at 30 September 2026, compared with Rs 634.26 crore at 31 March 2026, while long-term debt including current maturities decreased to Rs 230.79 crore from Rs 244.65 crore. Net worth rose to Rs 1,197.38 crore from Rs 1,191.15 crore over the same period.
What caused Dhampur's short-term debt to decline?
Dhampur disclosed a Rs 462.88 crore decline in short-term debt between 31 March 2026 and 30 September 2026, but the presentation does not identify a specific operating or financing event behind the reduction. The short-term balance at September was also below the Rs 196.84 crore reported a year earlier, on 30 September 2025.
The long-term debt mix changed during the six months even though total long-term debt declined by Rs 13.86 crore. Debt with a maturity above one year fell to Rs 111.40 crore at September 2026 from Rs 143.69 crore in March 2026, while long-term debt due within one year increased to Rs 119.39 crore from Rs 100.96 crore. Together, those two categories totalled Rs 230.79 crore at September 2026.
How did Dhampur's liquidity position move?
Dhampur increased cash and liquid investments to Rs 334.27 crore at 30 September 2026 from Rs 267.25 crore at 31 March 2026, an increase of Rs 67.02 crore. The September cash and liquid-investment balance was also Rs 96.14 crore above the Rs 238.13 crore reported at 30 September 2025.
Current assets moved lower despite the increase in cash and liquid investments. Dhampur reported current assets of Rs 376.55 crore at 30 September 2026, compared with Rs 1,028.41 crore at 31 March 2026 and Rs 441.97 crore a year earlier. Total assets declined to Rs 1,839.95 crore from Rs 2,412.52 crore in March, while non-current assets rose to Rs 1,129.13 crore from Rs 1,116.86 crore.
Trade payables also fell in the six months to September 2026. They were Rs 53.37 crore at 30 September 2026, versus Rs 158.10 crore at 31 March 2026, while other current liabilities increased to Rs 63.08 crore from Rs 57.48 crore. Deferred tax liabilities decreased to Rs 95.65 crore from Rs 97.25 crore.
Got a follow-up? Ask IRIS
Did Dhampur's earnings improve in H1 FY27?
Dhampur's earnings before interest, tax, depreciation and amortisation, or EBITDA, rose to Rs 82.97 crore in H1 FY27 from Rs 41.09 crore in H1 FY26. EBITDA margin increased to 5.61% from 2.83%, profit before tax changed to Rs 31.72 crore from a loss of Rs 12.37 crore, and profit after tax was Rs 17.79 crore against a Rs 8.05 crore loss.
Gross operating revenue reached Rs 1,479.68 crore in H1 FY27, up from Rs 1,451.72 crore in H1 FY26, while net operating revenue increased to Rs 1,054.85 crore from Rs 1,024.55 crore. Sugar revenue rose to Rs 725.39 crore from Rs 707.15 crore, ethanol revenue increased to Rs 259.28 crore from Rs 235.77 crore, and power revenue declined to Rs 31.25 crore from Rs 44.03 crore.
Management attributed the H1 comparison partly to sugar realisation of Rs 43,149 per tonne, compared with Rs 39,977 per tonne a year earlier, and ethanol sales of 318.29 lakh bulk litres, compared with 314.86 lakh bulk litres. It also identified lower sugar sales of 1.52 lakh tonnes versus 1.59 lakh tonnes, chemicals sales of 144.60 lakh kg versus 166.05 lakh kg, and power exports of 0.42 crore units versus 0.95 crore units as negative factors.
Which coverage and liquidity ratios changed at Dhampur?
Dhampur reported a current ratio of 1.75 at 30 September 2026, compared with 1.36 at 31 March 2026 and 1.78 at 30 September 2025. Its interest service coverage ratio was 3.30 at September, below 4.01 in March but above 1.57 a year earlier; the presentation does not provide the calculation methodology for either ratio.
Long-term debt to EBITDA was 2.78 at 30 September 2026, compared with 1.25 in March 2026 and 6.96 in September 2025. Fixed asset coverage ratio, identified as FACR in the presentation, rose to 6.50 from 6.31 in March and 5.19 a year earlier. Net fixed assets, including capital work in progress, were Rs 1,090.55 crore at September 2026, versus Rs 1,087.85 crore at March 2026.
Conclusion
Dhampur's September 2026 balance sheet shows a substantial reduction in short-term debt alongside higher cash and liquid investments. The Rs 462.88 crore fall in short-term debt, Rs 67.02 crore increase in cash and liquid investments, and H1 FY27 EBITDA of Rs 82.97 crore corresponded with a net debt-to-EBITDA ratio of 0.90 and debt-to-equity of 0.34.
What to watch next is whether the September position persists, particularly the Rs 334.27 crore cash and liquid-investment balance, Rs 171.38 crore short-term debt and 1.75 current ratio. The presentation does not disclose a specific reason for the short-term debt reduction or a forward debt target, while H1 volumes declined in sugar, chemicals, power exports and potable spirits.