










Dynamatic Technologies Limited cash flow falls 41% as debt rises
Key highlights
- Dynamatic’s H1 FY27 net operating cash flow fell 41% to Rs 30.46 crore from Rs 51.93 crore.
- Inventory absorbed Rs 87.36 crore of cash in H1 FY27, compared with Rs 37.53 crore in H1 FY26.
- Dynamatic’s net debt rose to Rs 512.46 crore at September 2026 from Rs 473.14 crore at June 2026.
- H1 FY27 profit after tax increased to Rs 43.25 crore from Rs 14.08 crore a year earlier.
powered by IRIS
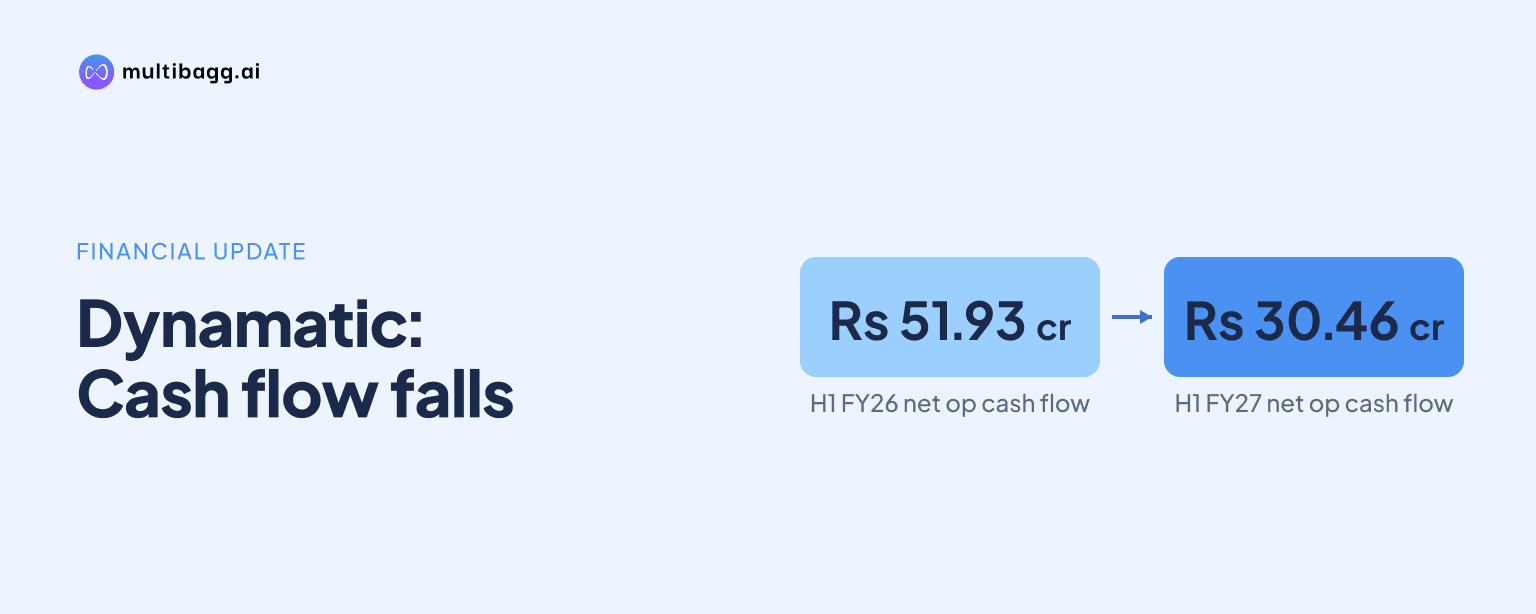
Dynamatic Technologies Limited generated Rs 30.46 crore of net operating cash flow in H1 FY27, down 41% from Rs 51.93 crore a year earlier, despite profit after tax rising to Rs 43.25 crore. Inventory absorbed Rs 87.36 crore of cash, while net debt increased to Rs 512.46 crore at September 2026.
Know Dynamatic Technologies inside out
Results, valuation, peers and who's buying, in one view.
Why did Dynamatic’s operating cash flow fall in H1 FY27?
Dynamatic’s operating cash flow fell because higher working-capital investment outweighed growth in profit and non-cash adjustments. Cash generated from operations declined to Rs 38.79 crore in H1 FY27 from Rs 53.93 crore in H1 FY26, while net cash generated from operating activities decreased to Rs 30.46 crore from Rs 51.93 crore after tax payments.
The reduction occurred even though cash flow before working-capital changes increased 45.2% to Rs 128.92 crore from Rs 88.76 crore. Profit before tax after exceptional items rose to Rs 51.53 crore from Rs 26.97 crore, supported by depreciation, amortisation and finance-cost adjustments. The subsequent working-capital movements therefore absorbed more cash than the improvement in underlying pre-working-capital cash generation.
H1 FY27 profit after tax rose to Rs 43.25 crore from Rs 14.08 crore, while revenue from operations grew 15.0% to Rs 877.54 crore. Earnings before interest, tax, depreciation and amortisation, or EBITDA, increased 31.8% to Rs 110.74 crore and the EBITDA margin rose to 12.6% from 11.0%, but these reported earnings gains did not translate into higher operating cash flow during the half year.
How much cash did inventory and working capital absorb?
Inventory was Dynamatic’s largest working-capital cash use, absorbing Rs 87.36 crore in H1 FY27 versus Rs 37.53 crore in H1 FY26. The year-on-year increase in the inventory outflow was Rs 49.83 crore, exceeding the Rs 40.16 crore increase in operating cash flow before working-capital changes.
Inventories on the balance sheet rose to Rs 491.78 crore at H1 FY27 from Rs 411.84 crore at FY26 and Rs 390.95 crore at H1 FY26. Other assets absorbed Rs 34.00 crore of cash in H1 FY27, compared with Rs 6.92 crore a year earlier. Trade receivables released Rs 9.55 crore, compared with Rs 3.15 crore in H1 FY26, while trade payables generated Rs 18.54 crore, up from Rs 5.89 crore.
Tax payments also increased to Rs 8.33 crore from Rs 2.00 crore. Total current assets increased to Rs 1,050.44 crore at H1 FY27 from Rs 925.13 crore at FY26. Trade receivables were broadly unchanged at Rs 318.00 crore, compared with Rs 318.45 crore at FY26, indicating that inventory and other assets accounted for most of the current-asset increase.
How did Dynamatic’s debt change by September 2026?
Dynamatic’s net debt increased to Rs 512.46 crore at September 2026 from Rs 473.14 crore at June 2026 and Rs 431.07 crore at September 2025. Total debt was Rs 590.82 crore at September 2026, and the capital-structure schedule deducted Rs 78.36 crore of cash and cash equivalents to calculate net debt.
Long-term debt rose to Rs 356.74 crore at September 2026 from Rs 299.49 crore at June 2026, an increase of Rs 57.25 crore. Short-term debt also rose, reaching Rs 234.08 crore from Rs 227.77 crore. Including lease liabilities of Rs 102.01 crore, overall debt stood at Rs 614.47 crore, compared with Rs 577.42 crore three months earlier.
Net debt to last-12-month EBITDA was 2.5 times at September 2026, compared with 2.4 times at June 2026 and 2.7 times at September 2025. Net debt to equity remained 0.6 times across all three reported dates. Net worth increased to Rs 841.42 crore from Rs 818.49 crore at June 2026, while last-12-month EBITDA rose to Rs 209.40 crore from Rs 200.01 crore.
Got a follow-up? Ask IRIS
How did Dynamatic fund cash flows in H1 FY27?
Dynamatic recorded a net financing inflow of Rs 11.79 crore in H1 FY27, compared with a net financing outflow of Rs 17.94 crore in H1 FY26. Proceeds from long-term borrowings increased to Rs 74.84 crore from Rs 44.91 crore, and net short-term borrowings added Rs 14.64 crore, compared with Rs 1.69 crore a year earlier.
These inflows were partly used for Rs 30.22 crore of long-term borrowing and lease-liability repayments, Rs 27.89 crore of interest payments, Rs 14.20 crore of lease payments and Rs 5.38 crore of dividend payments. Net cash used in investing activities declined to Rs 30.93 crore from Rs 39.47 crore because purchases of property, plant, equipment and intangible assets declined to Rs 32.72 crore from Rs 38.38 crore.
The combination of Rs 30.46 crore of operating cash flow, Rs 30.93 crore of investing outflow and Rs 11.79 crore of financing inflow resulted in a Rs 11.32 crore increase in cash and cash equivalents. Closing cash and cash equivalents were Rs 64.62 crore, compared with Rs 52.52 crore at the beginning of FY27. This differs from the Rs 78.36 crore cash-and-equivalents figure in the September capital-structure schedule.
Did higher earnings improve Dynamatic’s debt-servicing measures?
Dynamatic’s higher earnings lifted operating profit, although quarterly interest expense also rose. In Q2 FY27, interest expense was Rs 15.50 crore, compared with Rs 14.92 crore in Q1 FY27 and Rs 15.40 crore in Q2 FY26. Interest coverage, defined by Dynamatic as operating profit divided by interest expense, was 2.3 times in Q2 FY27, versus 2.4 times in Q1 FY27 and 1.8 times in Q2 FY26.
The group’s revenue growth was supported by all three operating segments in H1 FY27. Aerospace represented 47% of H1 revenue, while Hydraulics contributed 29% and Metallurgy 24%. Hydraulics revenue rose 17.5% to Rs 256.44 crore and its EBITDA rose to Rs 30.58 crore from Rs 10.81 crore. Metallurgy revenue increased 15.8% to Rs 207.67 crore and EBITDA reached Rs 7.47 crore, compared with Rs 0.18 crore a year earlier.
The contrast between profit and cash flow remains material: H1 EBITDA increased by Rs 26.72 crore and profit after tax by Rs 29.17 crore, while net operating cash flow decreased by Rs 21.47 crore. The presentation attributes the cash-flow outcome numerically to the working-capital movements rather than providing a separate explanation for the higher inventory balance.
Conclusion
Dynamatic reported higher H1 FY27 revenue, EBITDA and profit after tax, but its cash conversion moved in the opposite direction. Inventory absorption of Rs 87.36 crore and Rs 34.00 crore absorbed by other assets reduced operating cash flow to Rs 30.46 crore, while net debt rose by Rs 39.32 crore from June 2026 to Rs 512.46 crore at September 2026.
The next reporting periods will show whether inventories and other operating assets release cash as revenue expands. Management’s disclosed plans include scaling Bangalore Hydraulics operations after the Swindon product-line transfer, maintaining a leaner UK cost base, and advancing Metallurgy’s diversification into aerospace, defence and specialised engineering; the presentation also says the UK market is expected to remain subdued in the near term and European automotive demand remains soft.