










EFC: Design & Build reached 42% of EFC revenue mix in FY26
Key highlights
- EFC’s Design & Build share increased from 27% in FY24 to 42% in FY26.
- Leasing declined from 62% of EFC revenue in FY24 to 52% in FY26.
- EFC revenue from operations rose from Rs 419.5 crore in FY24 to Rs 1,036.7 crore in FY26.
- EFC reported FY26 EBITDA of Rs 468.3 crore and profit after tax of Rs 234.7 crore.
powered by IRIS
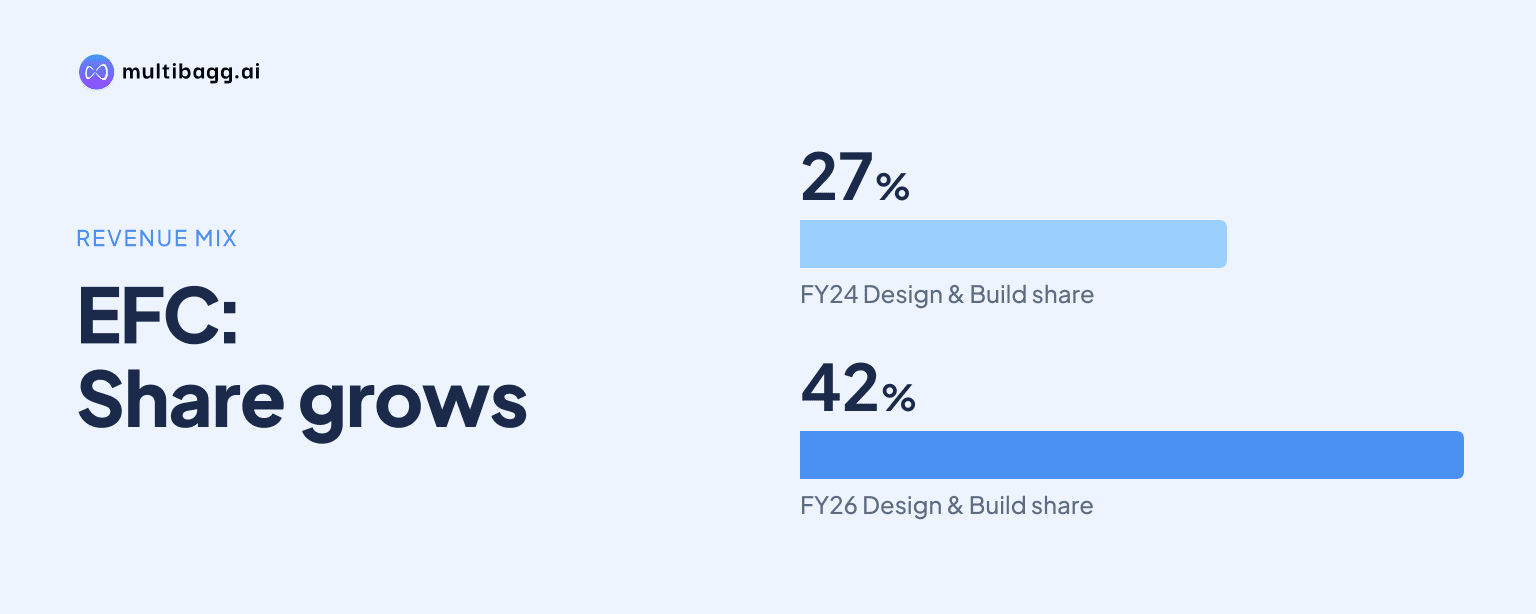
EFC (I) Ltd reported that Design & Build represented 42% of revenue in FY26, up from 27% in FY24, while Leasing declined to 52% from 62%. The 15-percentage-point increase in Design & Build’s share accompanied growth in revenue from operations to Rs 1,036.7 crore in FY26 from Rs 419.5 crore in FY24.
Know EFC (I) inside out
Results, valuation, peers and who's buying, in one view.
How did EFC’s revenue mix change from FY24 to FY26?
EFC moved towards a more balanced mix between Leasing and Design & Build over the three financial years disclosed. Leasing remained the largest vertical in FY26 at 52% of revenue, but its share was 10 percentage points below FY24’s 62%. Design & Build increased by 15 percentage points to 42% in FY26 from 27% in FY24.
Furniture accounted for the remaining share of the stated vertical mix and varied during the period. Its share declined from 11% in FY24 to 3% in FY25, before recovering to 6% in FY26. The FY26 mix comprised 52% Leasing, 42% Design & Build and 6% Furniture, compared with 62%, 27% and 11%, respectively, in FY24.
What changed in EFC’s mix during FY25 and FY26?
EFC’s largest annual mix change occurred in FY25, when Design & Build rose to 40% from 27% in FY24, an increase of 13 percentage points. In the same period, Leasing declined to 57% from 62%, while Furniture fell to 3% from 11%. Design & Build therefore accounted for almost two-fifths of reported revenue in FY25.
The shift continued in FY26, although at a slower pace. Design & Build added another 2 percentage points, reaching 42%, while Leasing fell another 5 percentage points to 52%. The gap between the two largest verticals was 10 percentage points in FY26, compared with 35 percentage points in FY24 and 17 percentage points in FY25.
The presentation reports revenue shares by vertical rather than separate revenue amounts. The disclosed data therefore establish the change in relative contribution, while consolidated revenue from operations increased to Rs 1,036.7 crore in FY26 from Rs 656.7 crore in FY25. As the vertical shares are presented as whole percentages, calculating precise rupee revenue for each vertical would imply precision not provided by EFC.
How did EFC’s earnings change as the revenue mix moved?
EFC’s revenue from operations rose by Rs 617.2 crore between FY24 and FY26, reaching Rs 1,036.7 crore from Rs 419.5 crore. Earnings before interest, tax, depreciation and amortisation, or EBITDA, increased to Rs 468.3 crore in FY26 from Rs 182.6 crore in FY24. EBITDA margin was 45.2% in FY26, compared with 43.5% in FY24, but below FY25’s 49.9%.
Profit after tax increased to Rs 234.7 crore in FY26 from Rs 63.3 crore in FY24, while the profit-after-tax margin rose to 22.6% from 15.1%. The FY26 margin was also above the 21.4% reported in FY25. These results coincided with Design & Build rising from 27% to 42% of revenue, but EFC does not assign revenue, margins or profit to individual verticals.
Got a follow-up? Ask IRIS
What does EFC disclose about the operating base behind FY26?
EFC reported total assets of Rs 2,675.1 crore at the end of FY26, compared with Rs 1,699.2 crore at the end of FY25 and Rs 980.3 crore at the end of FY24. Non-current assets were Rs 1,951.7 crore in FY26, including Rs 379.1 crore of right-of-use assets and Rs 322 crore of property, plant and equipment. The presentation does not link those assets separately to Leasing, Design & Build or Furniture.
Lease liabilities totalled Rs 1,098.3 crore at FY26, comprising Rs 836.2 crore of non-current lease liabilities and Rs 262.1 crore of current lease liabilities. This compared with Rs 647.3 crore at FY25 and Rs 291 crore at FY24. Borrowings were Rs 307.6 crore at FY26, consisting of Rs 237.9 crore of non-current borrowings and Rs 69.7 crore of current borrowings.
Working-capital-related balances also rose as revenue expanded. Trade receivables were Rs 244.7 crore at FY26, compared with Rs 98.3 crore at FY25 and Rs 124.3 crore at FY24. Inventories were Rs 37.5 crore at FY26, versus Rs 2.6 crore at FY25, while other current financial assets increased to Rs 207.6 crore from Rs 49.5 crore a year earlier.
Conclusion
EFC’s FY26 disclosures show that the difference between its two largest verticals narrowed substantially: Leasing represented 52% of revenue and Design & Build represented 42%, against 62% and 27% in FY24. Over the same period, revenue from operations increased by Rs 617.2 crore, EBITDA rose by Rs 285.7 crore and profit after tax increased by Rs 171.4 crore, although no vertical-level profitability is disclosed.
The next indicators to watch are EFC’s subsequent revenue-mix disclosures and any segment revenue or margin detail. The presentation cites FY27 pan-India office leasing of 85 million to 90 million square feet, expected growth of 12% to 14%, and rent growth of 4% to 6%; these market expectations provide the stated context for Leasing activity, while future reporting will show whether Design & Build’s 42% contribution changes further.