










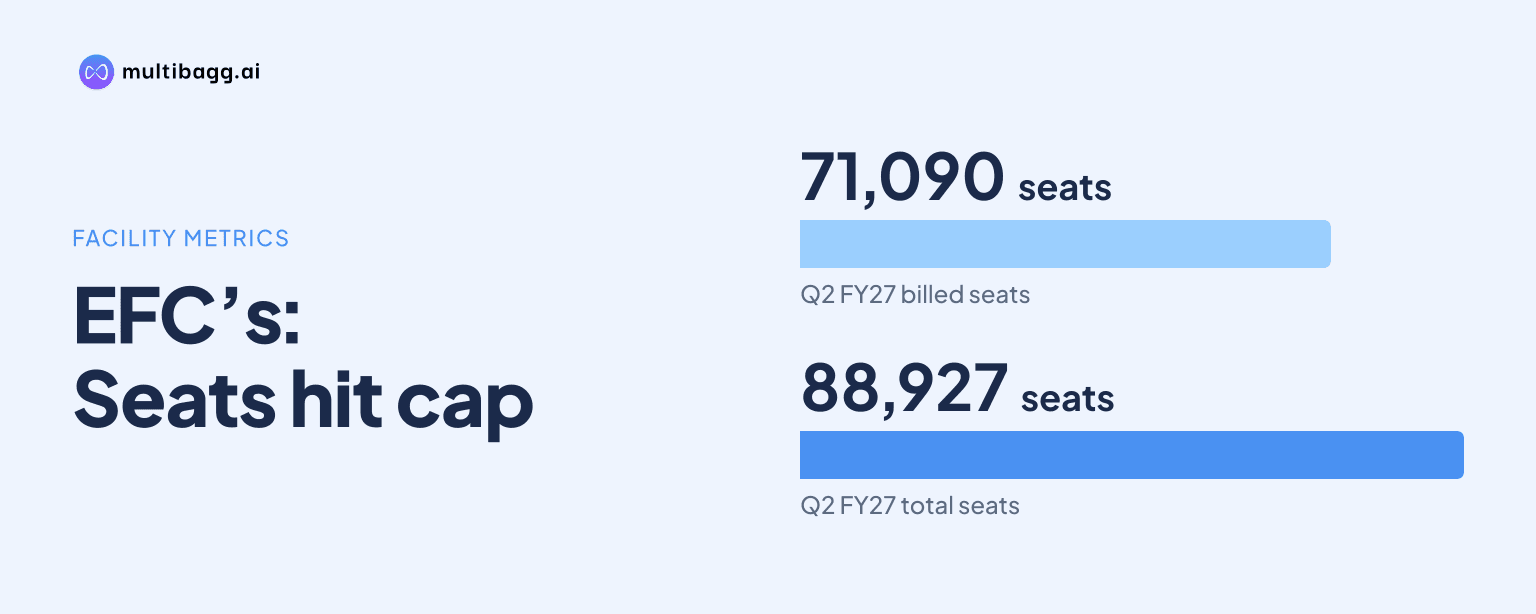
EFC’s billed seats reached 71,090 as capacity hit 88,927
Key highlights
- EFC reported 88,927 total seats and 71,090 billed seats in Q2FY27.
- Total seats increased by 20,686 from 68,241 in Q2 FY26 to 88,927 in Q2FY27.
- EFC listed 10,159 seats under development and 7,678 seats of inventory.
- EFC reports more than 90% occupancy at stabilised centres and average enterprise client tenure of 50 months.
powered by IRIS
AEFC® Real Estate as a Service Company, referred to in its presentation as EFC, reached 88,927 total managed-office seats and 71,090 billed seats in Q2FY27, compared with 68,241 and 55,924 respectively in Q2 FY26. EFC linked roughly 30% seat expansion to roughly 30% year-on-year revenue growth and listed 10,159 seats under development.
Know EFC (I) inside out
Results, valuation, peers and who's buying, in one view.
How quickly did EFC add managed-office seats?
EFC added 20,686 total seats between Q2 FY26 and Q2FY27, taking total seats from 68,241 to 88,927, an increase of about 30%. Over the same period, the number of centres rose to 182 from 86, while EFC reported operations across 39 cities.
The quarterly data show that total seats increased in every reported quarter from Q2 FY26. Total seats rose from 73,932 in Q3 FY26 to 78,782 in Q4 FY26, then to 84,387 in Q1 FY27 and 88,927 in Q2FY27. This sequence added 4,540 seats in the latest quarter, after a 5,605-seat increase in Q1 FY27.
EFC also identifies 7,678 seats as inventory and 10,159 seats as capacity under development. Its disclosed addition includes 95,897 square feet in an A+ category building at Koregaon Park Annex, taken on a five-year lease. These additions mean the reported 88,927-seat base does not include all space that EFC has identified for future operation.
What does EFC’s billed-seat growth say about utilisation?
EFC’s billed seats increased by 15,166 from Q2 FY26 to Q2FY27, rising to 71,090 from 55,924 while total seats increased by 20,686. The difference between total and billed seats was therefore 17,837 in Q2FY27, compared with 12,317 in Q2 FY26, indicating that total seats were added faster than billed seats over that period.
The latest quarter produced 3,061 additional billed seats, from 68,029 in Q1 FY27 to 71,090 in Q2FY27. That quarterly increase was below the 4,540-seat increase in total seats, whereas Q4 FY26 added 4,589 billed seats against 4,850 total seats. The figures show continuing conversion into billed seats alongside a larger total-seat base.
At stabilised centres, EFC reports occupancy above 90% and retention above 95%. EFC says monthly realisation per seat of Rs 7,300 to Rs 7,500 supports revenue visibility. These measures apply to stabilised centres, rather than representing a stated occupancy level across all 88,927 total seats.
How does EFC turn a new centre into revenue?
EFC says its integrated delivery model can complete fit-outs in three months, allowing revenue generation to begin in month 3 of a five-year lease. Under the timeline shown, operations begin at M3, the rent-free period ends at M5, and the centre reaches a stabilised stage at M9.
During M0 to M3, EFC shows zero occupancy, no revenue and no rent expense because fit-out is under way in the rent-free period. From M3 to M5, it shows 50% occupancy and revenue generation while rent expense remains nil. In the M5 to M9 stage, occupancy reaches 60%, revenue continues and lease rent becomes payable.
EFC says occupancy exceeds 90% from M9 through M48 or M60, while its average enterprise client tenure is 50 months. EFC’s stated mechanism is that monetisation starts during three of the five rent-free months and 60% occupancy is achieved before full rental payments begin. This timeline is a model presented by EFC, rather than a separately reported average outcome for all centres.
Got a follow-up? Ask IRIS
Which clients and regions shape EFC’s leasing revenue?
EFC reports that enterprise-centric revenue accounts for 68% of leasing revenue, and 36% of its clients operate across multiple cities. Its average enterprise client tenure is 50 months, while the top 10 clients contribute 22% of revenue, defining the disclosed enterprise orientation and customer concentration of the portfolio.
Rental revenue is distributed across six sector groupings. Information technology, technology and software development is the largest named category at 31%, followed by other sectors including energy, agri-tech, edutech, fast-moving consumer goods and healthcare at 24%. Business consulting and professional services contributes 22%, engineering and manufacturing 12%, banking, financial services and insurance 8%, and artificial intelligence, visual effects and gaming 3%.
EFC’s seat base is concentrated in the West, which holds 58,755 seats, 93 centres and 66% of capacity. North has 14,021 seats across 29 centres and 16% of capacity; South has 13,570 seats across 39 centres and 15%; and East has 2,581 seats across 21 centres and 3%. The regional figures show that the West is EFC’s largest operating zone.
What economics and plans support EFC’s further seat expansion?
EFC reports a fit-out cost of Rs 50,000 per seat and an 18-to-20-month payback period for its leasing model. It also reports revenue-to-rent of 2.5 times and says leasing at leased centres produces a selling price of Rs 181 per square foot and earnings before interest, tax, depreciation and amortisation, or EBITDA, of Rs 64 per square foot, equivalent to an indicated EBITDA margin of about 35%.
EFC attributes faster centre delivery and cost control to its design-and-build and furniture capabilities. Its design-and-build order book is Rs 300 crore, with more than 85% of design-and-build plus furniture backlog from external clients. Management expects about 50% FY27 revenue growth in these operations, while also stating that project conversion, execution and reported margins warrant monitoring.
For furniture, EFC reports FY26 utilisation of about 35% to 40% and sets a target of 60% to 70% by the end of FY27. EFC says the Ultrafresh business expands its kitchens and wardrobes offering and adds a North India presence. The company also reports a furniture profit-before-tax margin of about 24%, describing utilisation, volume and product mix as relevant to earnings.
Conclusion
EFC’s Q2FY27 operating data show a larger managed-office platform, with total seats at 88,927 and billed seats at 71,090. Compared with Q2 FY26, both measures increased, although total seats increased by more than billed seats, widening the reported difference between total and billed inventory. EFC’s 68% enterprise-centric revenue share, 50-month average enterprise tenure and more-than-90% stabilised-centre occupancy are its stated supports for recurring leasing revenue.
The next disclosed milestones are the conversion of 10,159 seats under development into operating capacity and the movement of new centres through the M3, M5 and M9 ramp-up stages. Management’s FY27 plans also include approximately 50% revenue growth in design and build, and furniture utilisation of 60% to 70% by FY27-end, compared with about 35% to 40% in FY26.