










Effwa debt-to-equity rises to 0.50x amid asset build-up
Key highlights
- Effwa’s debt-to-equity ratio rose to 0.50x in H1 FY27 from 0.31x in FY26.
- Capital work-in-progress reached Rs 23.06 crore at Sept-26, versus Rs 19.77 crore at Mar-26.
- Short-term borrowings increased to Rs 47.04 crore at Sept-26 from Rs 24.33 crore at Mar-26.
- Effwa reported a 3.30x current ratio and 23.90x interest coverage ratio in H1 FY27.
powered by IRIS
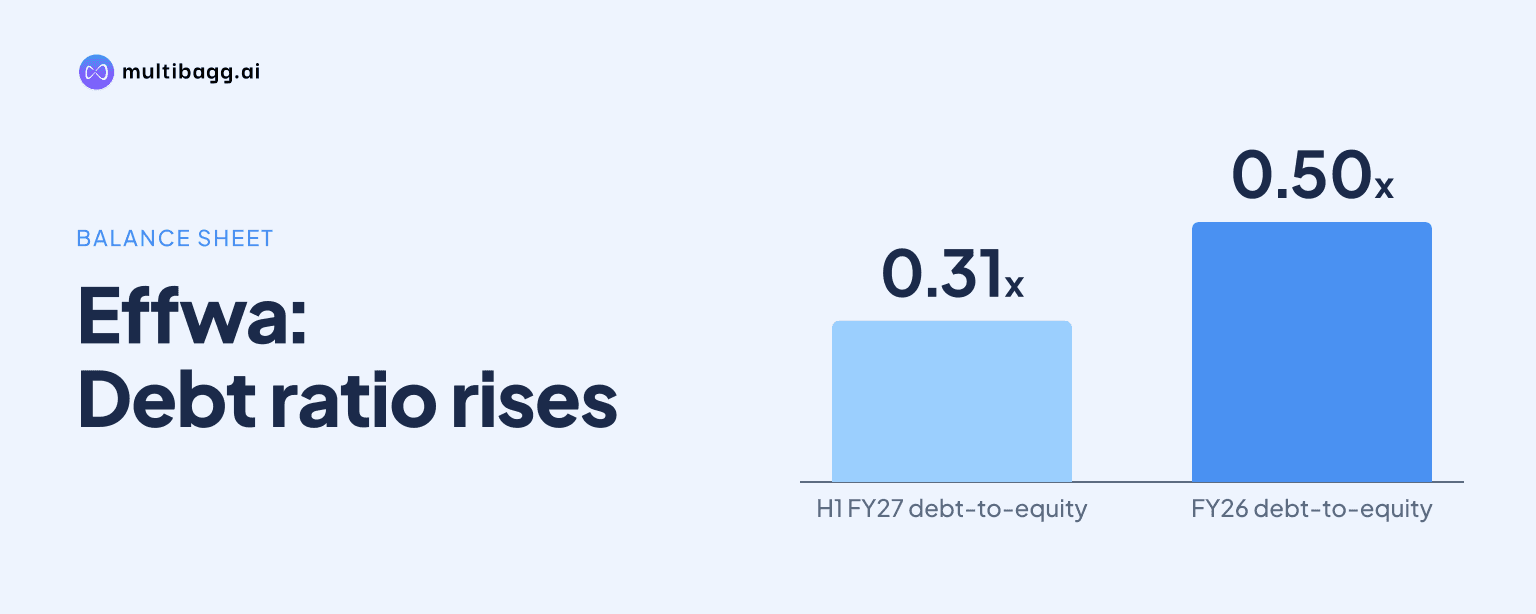
Effwa Infra & Research Ltd reported a 0.50x debt-to-equity ratio in H1 FY27, up from 0.31x in FY26, as capital work-in-progress reached Rs 23.06 crore at Sept-26 and borrowings increased. Effwa also reported a 3.30x current ratio and 23.90x interest coverage ratio for H1 FY27.
Know Effwa Infra & Research inside out
Results, valuation, peers and who's buying, in one view.
Why did Effwa’s debt-to-equity ratio rise to 0.50x?
Effwa’s debt-to-equity ratio rose because borrowings increased faster than total equity between FY26 and H1 FY27. The ratio was 0.31x in both FY25 and FY26 before reaching 0.50x in H1 FY27, although it remained below the 0.69x reported in FY23. The presentation does not provide a separate reconciliation of the debt definition used in the ratio.
Long-term borrowings increased to Rs 22.47 crore at Sept-26 from Rs 13.67 crore at Mar-26 and Rs 3.09 crore at Mar-25. Short-term borrowings reached Rs 47.04 crore, compared with Rs 24.33 crore at Mar-26 and Rs 26.61 crore at Mar-25. Total equity also rose to Rs 138.60 crore at Sept-26 from Rs 123.50 crore at Mar-26, but the expansion in both borrowing categories coincided with higher reported leverage.
The rise in borrowings also changed the balance-sheet composition. Total liabilities increased to Rs 82.04 crore at Sept-26 from Rs 60.92 crore at Mar-26, while total assets increased to Rs 220.64 crore from Rs 198.09 crore. At Sept-25, total liabilities were Rs 35.37 crore and total assets were Rs 140.40 crore, showing that both funding and assets expanded over the longer comparison period.
How large is Effwa’s capital work-in-progress build-up?
Effwa’s capital work-in-progress was Rs 23.06 crore at Sept-26, an increase of Rs 3.29 crore from Rs 19.77 crore at Mar-26. The balance was Rs 1.58 crore at Sept-25, indicating that most of the increase occurred during FY26 and H1 FY27. Capital work-in-progress represented most of total non-current assets of Rs 24.11 crore at Sept-26.
The wider asset build-up also included working-capital balances. Trade receivables rose to Rs 133.36 crore at Sept-26 from Rs 128.71 crore at Mar-26 and Rs 95.47 crore at Sept-25. Inventory increased to Rs 8.97 crore from Rs 26.5 lakh at Mar-26, while cash and bank balances increased to Rs 46.75 crore from Rs 43.29 crore.
Effwa’s tangible assets increased to Rs 98.9 lakh at Sept-26 from Rs 58.7 lakh at Mar-26. The presentation identifies the capital work-in-progress balance but does not specify the projects involved, their completion timetable, commissioning date or expected revenue contribution. It therefore establishes the scale of investment but not the eventual return or timing of asset deployment.
Got a follow-up? Ask IRIS
Is Effwa’s short-term liquidity improving despite higher borrowings?
Effwa’s reported current ratio improved to 3.30x in H1 FY27 from 2.92x in FY26 and 2.88x in FY25. Current assets were Rs 196.53 crore at Sept-26 and current liabilities were Rs 59.57 crore, compared with Rs 177.67 crore and Rs 60.92 crore, respectively, at Mar-26. The reported ratio increased as current assets rose while current liabilities declined.
Cash and cash equivalents of Rs 46.75 crore at Sept-26 were Rs 29 lakh below short-term borrowings of Rs 47.04 crore. Receivables were the largest current-asset item at Rs 133.36 crore, followed by inventory of Rs 8.97 crore and other current assets of Rs 4.54 crore. The current ratio therefore includes a substantial receivables balance rather than cash alone.
Cash-flow movements differed from the balance-sheet liquidity ratios. Net cash used in operating activities was Rs 23.73 crore for Sept-26, compared with net cash generated from operations of Rs 23.50 crore for Sept-25. Changes in working capital used Rs 39.45 crore in the Sept-26 period, compared with a Rs 12.89 crore inflow a year earlier.
Financing activities generated Rs 7.15 crore of cash in the Sept-26 period, whereas they used Rs 7.71 crore in the Sept-25 period. Investing activities used Rs 3.84 crore at Sept-26, compared with Rs 1.68 crore a year earlier. The resulting net decrease in cash and cash equivalents was Rs 20.42 crore, against an increase of Rs 14.12 crore in the comparative period.
Can Effwa cover its finance cost from operating earnings?
Effwa reported an interest coverage ratio of 23.90x for H1 FY27, compared with 11.53x in FY26 and 11.72x in FY25. Earnings before interest and tax were Rs 21.01 crore in H1 FY27, while finance cost was Rs 88.5 lakh. This combination coincided with higher reported coverage despite the increase in balance-sheet borrowings.
Finance cost was Rs 1.76 crore in H1 FY26, while earnings before interest and tax were Rs 15.32 crore. Revenue from operations increased 44.8% year on year to Rs 130.65 crore in H1 FY27, and profit after tax increased 48.8% to Rs 15.10 crore. Earnings before interest, tax, depreciation and amortisation, or EBITDA, rose 37.1% to Rs 21.15 crore.
Profitability ratios did not all move in the same direction. EBITDA margin was 16.2% in H1 FY27, down 90 basis points from 17.1% in H1 FY26, while profit after tax margin increased 40 basis points to 11.6%. Return on capital employed was 26.5% in H1 FY27 versus 30.5% in FY26, and return on equity was 22.1% versus 26.2%.
Conclusion
Effwa’s H1 FY27 balance sheet shows simultaneous expansion in assets, borrowings and equity. The 0.50x debt-to-equity ratio was above the 0.31x level reported in FY25 and FY26, while capital work-in-progress reached Rs 23.06 crore and operating cash flow turned to an outflow of Rs 23.73 crore. At the same time, the current ratio improved to 3.30x and interest coverage rose to 23.90x.
The next disclosures to watch are the composition, completion status and funding requirements of the Rs 23.06 crore capital work-in-progress balance, which the presentation does not detail. Investors can also track whether receivables of Rs 133.36 crore and inventory of Rs 8.97 crore convert into operating cash after the Rs 39.45 crore working-capital outflow reported for Sept-26.