










eMudhra Limited outlook stays balanced after 43% annual fall
Key highlights
- eMudhra closed at Rs 360.75 on 9 November 2026, down 4.49% for the day.
- The stock declined 30.55% over six months and 42.95% year on year.
- A 2027 model base case of Rs 423 assumes 17.1% annual EPS growth and a 24.14 price-to-earnings ratio.
- The cited price-to-earnings ratio of 24.14 exceeds the reported industry ratio of 19.36.
powered by IRIS
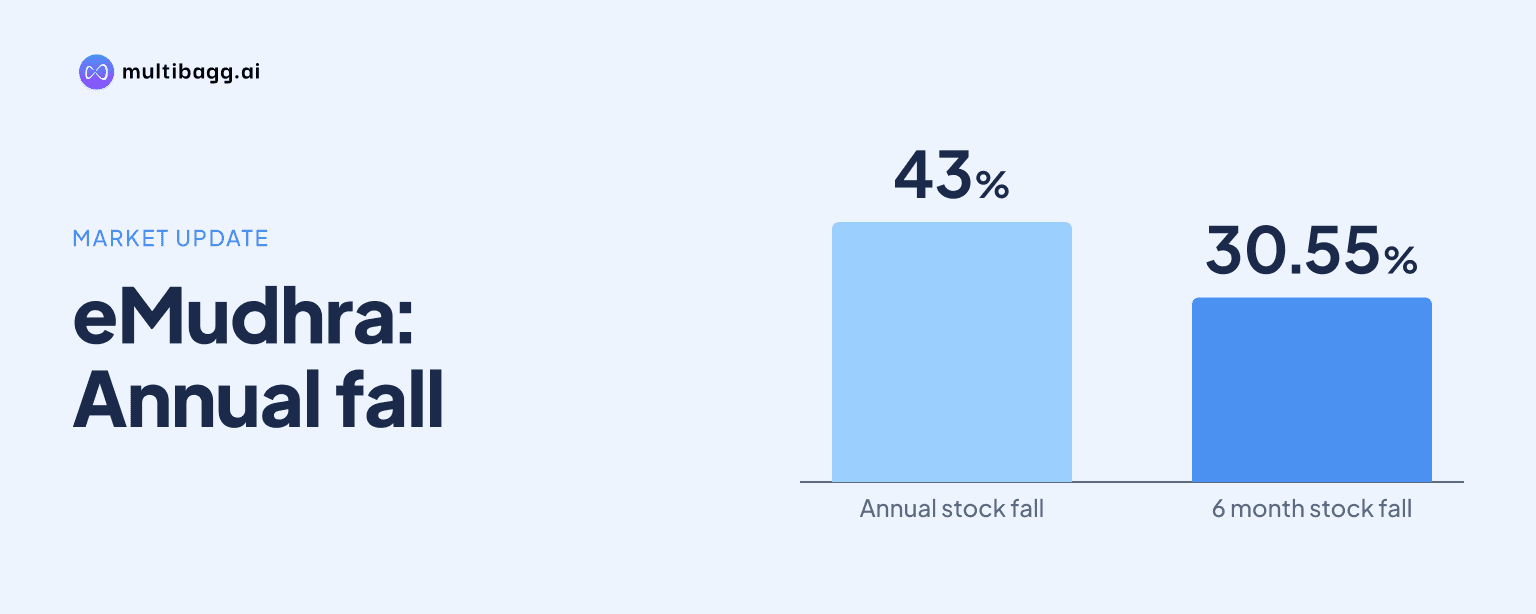
eMudhra Limited's share-price outlook appears balanced rather than decisively bullish or bearish after the stock closed at Rs 360.75 on 9 November 2026, down 42.95% year on year. Reported earnings growth supports the constructive case, but a premium valuation, weak longer-term price performance and inconsistent analyst-coverage data warrant caution.
Why has eMudhra's share price fallen?
eMudhra's share price has weakened sharply over longer periods, despite reports of growth in revenue, operating profit and net profit. The stock was reported at Rs 360.75, down Rs 16.95 or 4.49% for the day, with a six-month decline of 30.55% and a year-on-year fall of 42.95%. It also underperformed the Nifty by 36.96% over one year, according to the supplied market snapshot.
The available price data show that eMudhra was trading well below its 52-week high of Rs 681.60, while remaining above the reported 52-week low of Rs 314.00. On 9 November, the intraday range was Rs 358.55 to Rs 381.15. This context explains why social-media discussions have focused on whether the decline presents value or signals continued pressure.
What supports the case for holding eMudhra?
eMudhra's reported profit and earnings growth provide the main support for a hold-oriented view. One dataset stated that the company delivered profit growth at a 43.0% compound annual rate over five years, while another said revenue, operating profit and net profit were growing. The target model cited in online discussions assumes earnings per share growth of 17.1% a year, matching the reported FY24-to-FY26 pace.
MarketsMojo rated eMudhra as Hold, with the rating last updated on 29 September 2026. Its rationale was that the company had positive financial trends and strong quality metrics, but did not appear sufficiently undervalued for aggressive buying. The same assessment described the price-to-book ratio as about 3.1 and said the valuation was fair, while noting mildly bearish technical signals.
The hold case is therefore not based on an expectation of immediate price appreciation. It rests on the view that existing investors may wait for future quarterly results, institutional activity and sector developments before reassessing their position. The context does not provide a fresh earnings release or a management forecast that would settle that debate.
Got a follow-up? Ask IRIS
Is eMudhra expensive at the current valuation?
eMudhra carries valuation risk because the reported price-to-earnings ratio of 24.14 is above the cited industry price-to-earnings ratio of 19.36. A separate automated fundamentals screen also classified the stock as overvalued relative to peers, even while assigning excellent marks to earnings and noting growth across key profit measures.
Valuation signals in the supplied material are not fully uniform. MarketsMojo called the valuation fair and pointed to a price-to-book ratio of roughly 3.1 at a discount to peers' historical averages. However, it also concluded that eMudhra was not undervalued enough to justify a strong buy. Investors weighing the stock need to distinguish between a business showing growth and a share price that already reflects part of that growth.
Return metrics add another consideration. The company was reported to have a three-year return on equity of 12.9%, described as low in the supplied context. That does not determine the share-price direction, but it is relevant when comparing eMudhra's valuation with its financial returns and peer benchmarks.
What share-price scenarios are being discussed for eMudhra?
eMudhra's published scenarios span a wide range, showing that the available projections are uncertain rather than a single market consensus. A model-based 2027 base case puts the share price at Rs 423, or 17.3% above Rs 360.75, assuming annual EPS growth of 17.1% and an unchanged price-to-earnings ratio of 24.14. Its bull case is Rs 512, while Rs 289 is presented as a downside risk level rather than a target.
Another market-data entry lists a Rs 702 average 12-month target from one analyst, implying 92.88% upside from Rs 360.75. Yet other supplied entries say there is no active sell-side coverage, no analyst-rating data or no consensus data. Because the Rs 702 figure is based on only one analyst and conflicts with the coverage-status entries, it should not be treated as a broad consensus.
Near-term technical readings were also mixed. One snapshot described the overall setup as slightly bearish, although its RSI of 37.41 was labelled neutral and its MACD reading was labelled bullish. It identified support levels of Rs 368.96, Rs 355.38 and Rs 345.36, with resistance at Rs 392.56, Rs 402.58 and Rs 416.16. These indicators describe recent price conditions, not business performance or guaranteed future levels.
Conclusion
eMudhra's outlook is balanced because the reported financial-growth indicators and the Rs 423 model-based base case coexist with a substantial annual share-price fall, a price-to-earnings premium to the cited industry level and subdued technical sentiment. The available material supports neither a clear sell conclusion nor an unqualified buy case, particularly given the inconsistent analyst-coverage information.
The next checkpoint is the company's upcoming quarterly results, which MarketsMojo specifically identified as important for reassessing the Hold stance. Investors can also watch whether earnings growth continues near the cited 17.1% annual pace, whether the valuation gap versus the industry narrows, and whether the stock stabilises relative to its reported Rs 314.00 to Rs 681.60 52-week range.