










Indian IPO Market: Valuation Discipline Shaped 2026 Listing Gains
Key highlights
- The mainboard and SME IPO market raised Rs 2.23 trillion through 375 issues, of which 230 listed above offer prices.
- The median listing-day gain for 131 mainboard IPOs was 6.8%, while the median return from offer price was 16.8%.
- IPOs above 50 times P/E averaged only 1.92% listing gains, versus 19.08% for the 30-50 times P/E band.
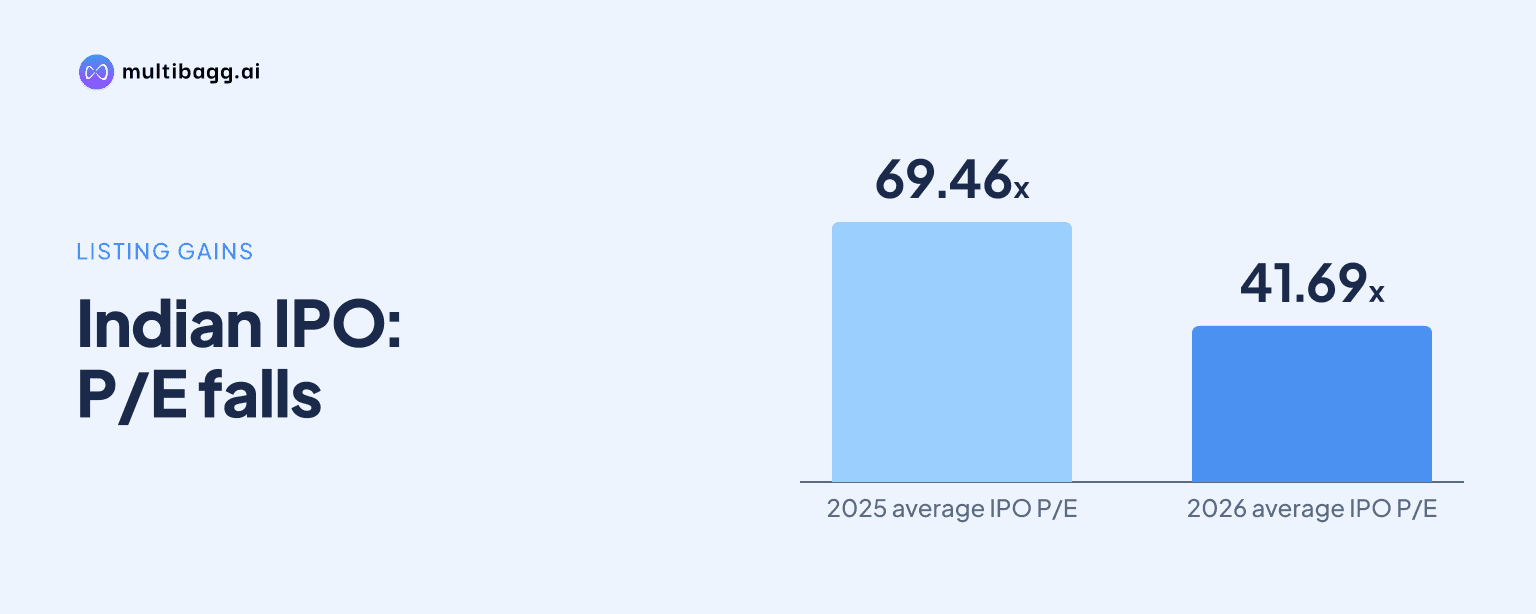
- Average IPO P/E multiples fell from 69.46 times in 2025 to 41.69 times in 2026.
powered by IRIS
Indian initial public offering market activity raised a record Rs 2.23 trillion through 375 mainboard and SME issues, with 230 listing above their issue prices, but 2026 data shows that valuation discipline mattered more than a simple premium-listing count. IPOs priced above 50 times earnings averaged only 1.92% listing gains in the valuation sample.
How did the IPO market perform in 2026?
The IPO market produced a large volume of fundraising and a majority of positive debuts, but returns varied materially across issues and time periods. The reported 375 mainboard and SME IPOs raised Rs 2.23 trillion, while 230 listed above their offer prices. That broad outcome indicates positive demand for many new issues, without suggesting that every offer generated the same result for investors.
Among 131 mainboard issues, 89 closed above the issue price on listing day and the median listing-day gain was 6.8%. On adjusted market prices reported on Friday, 87 mainboard issues remained above the offer price while 43 were below it. The median return from the offer price was 16.8%, showing that post-listing performance differed from the first-day outcome.
What do listing gains say about IPO valuation?
Listing gains do not move in a straight line with the issue price-to-earnings multiple. In an analysis of 238 IPOs with reported P/E ratios, offers valued below 15 times earnings delivered an average listing gain of 16.19%. Yet the strongest average gain came from the 30-50 times P/E band, rather than the lowest valuation group.
The 21 IPOs in the 30-50 times P/E range recorded an average listing gain of 19.08%, and 66.67% listed at a premium. By comparison, 131 IPOs below 15 times P/E had a 65.65% premium-listing ratio. The 15-30 times band averaged 8.25% across 71 IPOs, while the 15 issues valued above 50 times earnings averaged only 1.92%, with 46.67% listing at a premium.
Why are average and median IPO returns different?
Average listing gains can be lifted by a small number of exceptional performers, whereas the median shows the midpoint of outcomes. The IPO Listing Performance Tracker 2026 put the average listing gain at 12.83%, compared with a median of 2.91%. The average was 4.41 times the median, underlining the effect of large gains in selected stocks.
The same tracker reported average gains of 13.56% for mainboard IPOs and 12.40% for SME IPOs across 294 listings. Mainboard offers had a higher frequency of positive outcomes, with 68.52% listing at a premium against 54.84% for SMEs. For retail investors, this distinction matters because a headline average does not describe the typical issue or guarantee a premium at debut.
Got a follow-up? Ask IRIS
Which IPOs had the largest gains and losses?
Individual IPO outcomes ranged from triple-digit gains to steep declines, reinforcing the importance of stock-specific analysis. Among mainboard listings, Omnitech Engineering rose 166.2% from its offer price and KSH International gained 161.7%. Billionbrains Garage Ventures, the operator of Groww, was up 115.1%, while Meesho gained 110.3% and Lenskart Solutions rose 80.3%.
There were also notable laggards. Shree Ram Twistex was down 64.8% and Aastha Spintex declined 63.4%, the sharpest losses among the mainboard listings cited. Pine Labs was down 26.5% and SBI Funds Management was down 13%, while ICICI Prudential Asset Management Company was up 35.6% and Jio Platforms gained 25.7%. Such dispersion means subscription interest alone is not a sufficient measure of subsequent performance.
Why did investors become more selective about new issues?
Investors became more focused on valuation, profitability and earnings visibility as market conditions turned less supportive. Average IPO P/E multiples fell from 69.46 times in 2025 to 41.69 times in 2026, a decline of nearly 40%. The correction reflected greater scrutiny of what investors were paying for future earnings amid geopolitical uncertainty, elevated crude prices and foreign investor selling.
FY26 data also showed weaker broad-based listing enthusiasm than the previous year. Grant Thornton Bharat reported that average oversubscription fell to 39 times from 71 times in FY25, while average listing-day gains declined to 7% from 29%. PRIME Database said only 31% of FY26 IPOs generated listing gains above 10%, compared with 71% in the prior year. The figures suggest that strong demand and a positive debut did not consistently translate into sustained returns.
Conclusion
The IPO market's 2026 record fundraising was accompanied by uneven investor outcomes. Mainboard and SME offers frequently listed at premiums, but the wide gap between average and median gains, the weak result for the highest P/E group, and sharp stock-level losses show why issue valuation and business quality remain central to assessing a new listing.
Investors should watch whether newly listed companies sustain earnings and whether their valuations remain reasonable against listed peers using measures such as P/E and EV/EBITDA. The next useful markers are post-listing trading relative to the offer price, changes in market conditions, and whether the more selective approach to issue pricing continues.