










ENDURANCE Europe PAT rose 2% as depreciation offset acquisition gains
Key highlights
- ENDURANCE Europe H1FY27 PAT rose 2% to Rs 105 crore from Rs 103 crore.
- A Rs 54 crore phase-out depreciation charge partly offset a Rs 36 crore acquisition-accounting gain.
- ENDURANCE Europe H1FY27 total income rose 14% to Rs 2,175 crore, while euro-term growth was 3%.
- EU new-car registrations rose 6.6% in H1FY27 but remained 13.4% below H1FY19.
powered by IRIS
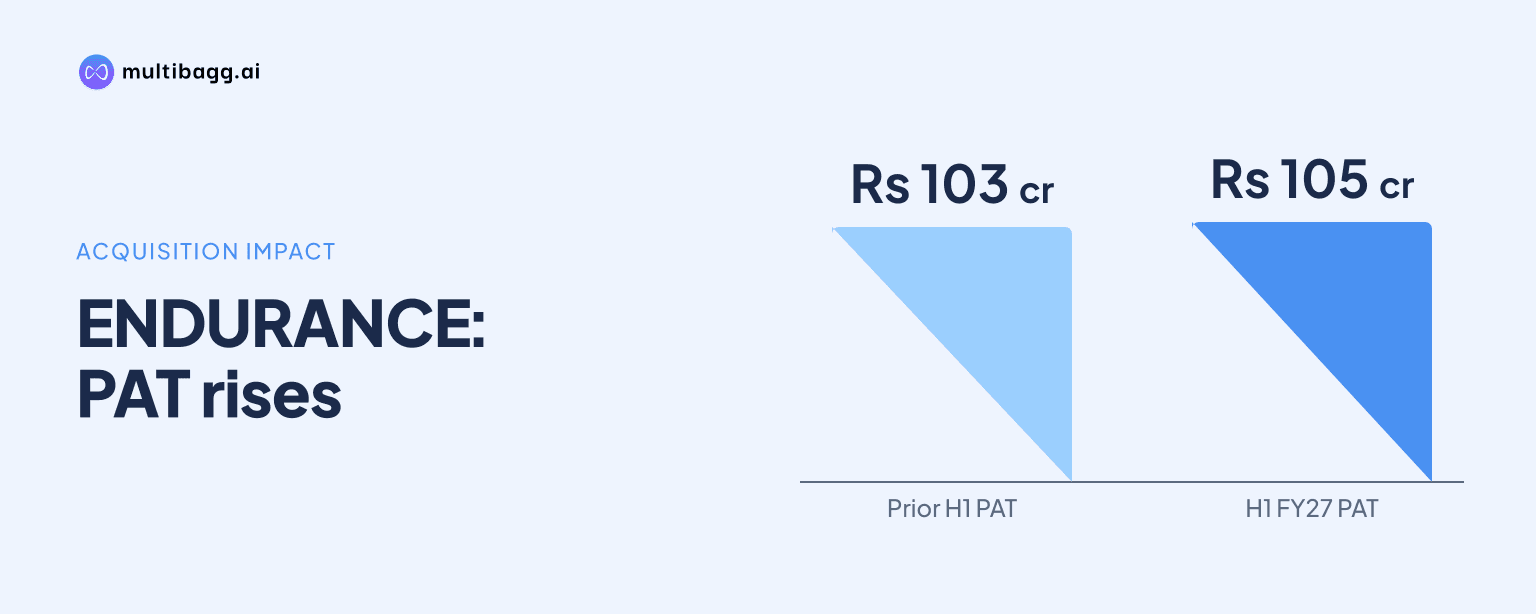
ENDURANCE Europe’s profit after tax (PAT) rose 2% year on year to Rs 105 crore in H1FY27, as Rs 54 crore of accelerated depreciation on original equipment manufacturer (OEM) programmes being phased out largely offset a Rs 36 crore gain from Stöferle acquisition accounting. Total income rose 14% in rupees, while PAT margin declined to 4.8%.
Know Endurance Technologies inside out
Results, valuation, peers and who's buying, in one view.
Why did ENDURANCE Europe’s H1FY27 PAT rise only 2%?
ENDURANCE Europe’s PAT increased by Rs 2 crore, or 2%, from Rs 103 crore in H1FY26 to Rs 105 crore in H1FY27. The reported result was affected by Rs 54 crore of accelerated depreciation related to OEM programmes being phased out, partly offset by a Rs 36 crore gain from Stöferle acquisition accounting.
The disclosed depreciation charge exceeded the acquisition-accounting gain by Rs 18 crore. This helps explain why PAT growth lagged the 14% increase in total income and the 17% increase in earnings before interest, tax, depreciation and amortisation (EBITDA). PAT margin declined by 0.6 percentage points, from 5.4% in H1FY26 to 4.8% in H1FY27.
The H1 outcome differed from Q2FY27, when Europe PAT rose 40% from Rs 41 crore in Q2FY26 to Rs 57 crore in Q2FY27. In that quarter, ENDURANCE disclosed a Rs 36 crore gain from Stöferle acquisition accounting and Rs 31 crore of accelerated depreciation on programmes being phased out.
The phase-out depreciation charge was Rs 23 crore higher in H1FY27 than in Q2FY27, while the disclosed acquisition-accounting gain was Rs 36 crore in both periods. The presentation does not identify the affected OEM programmes or give their phase-out timing, leaving the timing of the remaining H1 charge unspecified.
How did ENDURANCE Europe’s sales and EBITDA change in H1FY27?
ENDURANCE Europe’s total income rose 14% to Rs 2,175 crore in H1FY27 from Rs 1,910 crore in H1FY26, while growth in euro terms was 3%. The presentation reports both growth measures but does not separately quantify a currency effect.
EBITDA increased by Rs 55 crore to Rs 391 crore from Rs 336 crore, a 17% year-on-year rise. EBITDA margin moved up 0.4 percentage points to 18.0% from 17.6%, contrasting with the 0.6-percentage-point decline in PAT margin to 4.8%.
In Q2FY27, total income was Rs 1,029 crore, up 13% from Rs 908 crore in Q2FY26, with euro-denominated growth of 5.6%. Q2 EBITDA rose 14% to Rs 183 crore, while its margin remained 17.8% in both quarters and PAT margin rose to 5.5% from 4.5%.
The euro-revenue growth rate was 3% in H1FY27, below the 5.6% reported for Q2FY27. H1 EBITDA margin of 18.0% was 0.2 percentage points above the Q2 margin of 17.8%, although the presentation does not provide a Europe segment explanation for this difference.
Got a follow-up? Ask IRIS
What was the European vehicle and energy backdrop in H1FY27?
European Union new-car registrations rose 6.6% to 5.694 million in H1FY27 from 5.342 million in H1FY26, but remained 13.4% below H1FY19. Registrations excluding Chinese OEMs grew 1.9%, according to the presentation.
Germany recorded 1.522 million registrations, up 5.3% year on year but 18.2% below H1FY19. France registered 0.833 million vehicles, up 7.3% from H1FY26 but 23.4% below H1FY19, while Spain’s 0.612 million registrations were 5.7% below its H1FY19 level.
Italy registered 0.783 million vehicles in H1FY27, an 8.3% increase from H1FY26, but remained 15.8% below H1FY19. The presentation’s other European markets recorded 1.944 million registrations, up 6.8% year on year and 5.1% below the H1FY19 level.
Electricity on the PUN benchmark averaged EUR 153 per megawatt-hour in H1FY27, up 44% from EUR 106 in H1FY26 and 249% above FY21. PUN is the electricity-price benchmark named in the presentation.
Gas on the PSV benchmark was EUR 57 cents per cubic metre, up 53% from EUR 37 cents in H1FY26 and 332% above FY21. The presentation lists these market conditions alongside Europe’s financial data, but does not quantify their direct effect on Europe’s Rs 391 crore EBITDA.
How did ENDURANCE Europe compare with other ENDURANCE entities?
ENDURANCE Europe represented 24% of consolidated total income in H1FY27, down from 28% in H1FY26. Its Rs 2,175 crore of income was lower than standalone income of Rs 6,955 crore, while Maxwell reported Rs 141 crore; their respective H1FY27 shares were 75%, 24% and 1%.
At the consolidated level, total income increased 32% to Rs 9,159 crore in H1FY27 from Rs 6,958 crore in H1FY26. Consolidated EBITDA increased 18% to Rs 1,153 crore, but its margin declined to 12.6% from 14.0%, while consolidated PAT rose 14% to Rs 519 crore from Rs 454 crore.
Standalone PAT rose 16% to Rs 408 crore in H1FY27 from Rs 353 crore, while its PAT margin declined to 5.9% from 7.0%. Standalone total income increased 38% to Rs 6,955 crore, including a Rs 75 crore incentive booked in H1FY27 that was not identified on the Europe financial slide.
Maxwell moved to PAT of Rs 5 crore in H1FY27 from a loss of Rs 3 crore in H1FY26, as total income rose 91% to Rs 141 crore. Europe’s 2% PAT growth was below the 16% increase in standalone PAT and the 14% increase in consolidated PAT, while its 18.0% EBITDA margin exceeded the consolidated 12.6% margin.
Conclusion
ENDURANCE Europe generated Rs 2,175 crore of H1FY27 total income and Rs 391 crore of EBITDA, with EBITDA margin improving to 18.0%. PAT nevertheless advanced only Rs 2 crore to Rs 105 crore because the Rs 54 crore accelerated depreciation charge associated with phased-out OEM programmes exceeded the Rs 36 crore acquisition-accounting gain.
The next Europe disclosures should clarify whether accelerated depreciation related to OEM programme phase-outs continues beyond the Rs 54 crore reported in H1FY27. The demand and cost backdrop also remains relevant: EU registrations were 13.4% below H1FY19, while H1FY27 PUN electricity and PSV gas benchmarks were 44% and 53% higher year on year, respectively.