










Energy-Mission FY26 standalone profit fell despite sales growth
Key highlights
- Energy-Mission's standalone FY26 revenue rose to Rs 159.08 crore from Rs 150.49 crore in FY25.
- Energy-Mission's standalone FY26 PAT declined to Rs 11.16 crore from Rs 12.57 crore in FY25.
- Energy-Mission's standalone EBITDA margin declined to 13.41% in FY26 from 15.46% in FY24.
- Energy-Mission disclosed a Rs 47.23 crore order book and annual capacity of 1,500 machines as of July 2025.
powered by IRIS
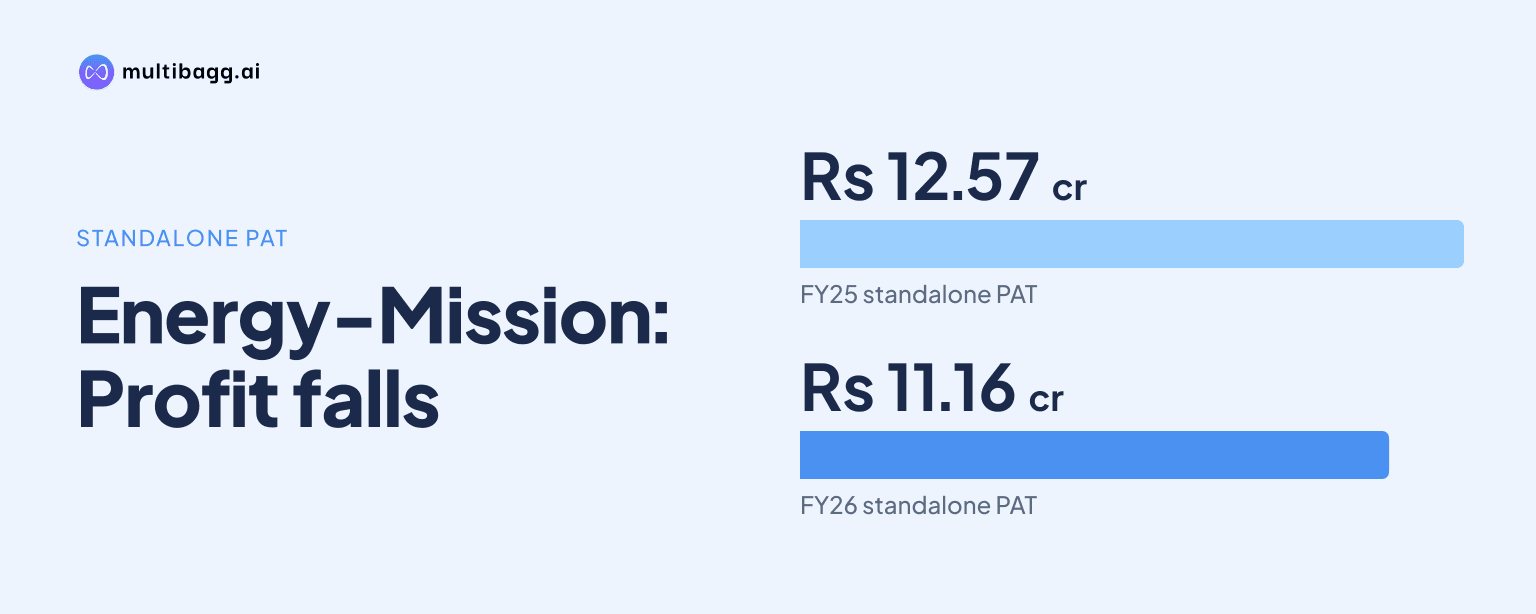
Energy-Mission Machineries (India) Limited recorded standalone revenue of Rs 159.08 crore in FY26, up from Rs 150.49 crore in FY25, but profit after tax fell to Rs 11.16 crore from Rs 12.57 crore and PAT margin declined to 7.01% from 8.35%.
Know Energy-Mission Machineries (India) inside out
Results, valuation, peers and who's buying, in one view.
How did Energy-Mission's standalone revenue and profit change?
Energy-Mission increased standalone revenue from operations in each of the two years through FY26, while its profit after tax, or PAT, peaked in FY25. Revenue rose by Rs 24.20 crore from Rs 126.29 crore in FY24 to Rs 150.49 crore in FY25, followed by a further Rs 8.59 crore increase in FY26. PAT rose from Rs 10.97 crore in FY24 to Rs 12.57 crore in FY25, before declining by Rs 1.41 crore in FY26.
Energy-Mission's FY26 PAT remained Rs 0.19 crore above FY24, despite falling below the FY25 result. Across FY24 to FY26, revenue rose by Rs 32.79 crore while PAT increased by Rs 0.19 crore. EBITDA increased from Rs 19.52 crore in FY24 to Rs 21.33 crore in FY26, although the increase between FY25 and FY26 was only Rs 0.06 crore.
Why did Energy-Mission's standalone margins decline in FY26?
Energy-Mission's standalone EBITDA margin declined for a second consecutive year to 13.41% in FY26, from 14.13% in FY25 and 15.46% in FY24. The FY26 margin was therefore 2.05 percentage points below the FY24 level, even as revenue reached its highest point in the three-year standalone series at Rs 159.08 crore. The presentation does not state a specific cause for the decline.
PAT margin also declined across all three reported standalone periods, moving from 8.68% in FY24 to 8.35% in FY25 and 7.01% in FY26. The FY26 PAT margin was 1.34 percentage points below FY25 and 1.67 percentage points below FY24. This means both EBITDA and PAT represented a smaller proportion of revenue in FY26 than in either preceding year.
Total standalone expenditure increased by Rs 8.52 crore in FY26 to Rs 137.75 crore, compared with an Rs 8.59 crore increase in revenue. EBITDA consequently rose by only Rs 0.06 crore to Rs 21.33 crore, producing the reported 13.41% EBITDA margin. The presentation does not provide a cost-category breakdown for the FY26 standalone expenditure figure.
What moved below EBITDA in Energy-Mission's FY26 accounts?
Energy-Mission's depreciation and interest expense both increased in FY26, contributing to the decline in profit below EBITDA. Depreciation rose by Rs 1.02 crore to Rs 3.80 crore from Rs 2.78 crore in FY25, while interest increased by Rs 0.56 crore to Rs 2.60 crore. Other income increased by Rs 0.18 crore to Rs 0.64 crore.
Profit before interest and tax, or PBIT, fell to Rs 18.17 crore in FY26 from Rs 18.95 crore in FY25 despite the small EBITDA increase. Profit before tax declined by Rs 1.34 crore to Rs 15.57 crore, while tax increased to Rs 4.41 crore from Rs 4.34 crore. The presentation reports these movements but does not explain the higher depreciation or interest charges.
Got a follow-up? Ask IRIS
How did Energy-Mission's standalone FY26 results compare with consolidated results?
Energy-Mission's consolidated FY26 revenue, EBITDA and PAT exceeded the standalone figures. Consolidated revenue was Rs 160.85 crore, compared with standalone revenue of Rs 159.08 crore; consolidated EBITDA was Rs 22.52 crore, compared with Rs 21.33 crore; and consolidated PAT was Rs 11.93 crore, compared with Rs 11.16 crore.
The EBITDA margin trend differed between the two reporting scopes. Consolidated EBITDA margin increased to 14.00% in FY26 from 13.70% in FY25, while standalone EBITDA margin declined to 13.41% from 14.13%. Consolidated PAT margin declined to 7.42% from 7.85%, but remained 0.41 percentage points above the 7.01% standalone FY26 PAT margin.
Energy-Mission's FY26 highlights page reports revenue of Rs 160.85 crore and PAT of Rs 11.93 crore, which match the consolidated income-statement figures. The annual income statement separately reports standalone FY26 revenue of Rs 159.08 crore and PAT of Rs 11.16 crore. The two sets of figures therefore cover different reporting scopes.
What is Energy-Mission planning after FY26?
Energy-Mission said it expanded manufacturing capacity from 900 machines a year to 1,500 machines a year as of July 2025. It also reported that the post-initial public offering manufacturing cycle was reduced from three to four months to two to three months. The presentation disclosed an order book of Rs 47.23 crore and said it provided revenue visibility.
Energy-Mission said its EM Press Form plant was scheduled to be operational in FY 2026-27. Its consolidated property, plant and equipment increased to Rs 56.57 crore at H1FY27 from Rs 35.38 crore at FY26, while capital work in progress declined to Rs 0.19 crore from Rs 17.66 crore. The presentation does not explicitly link these balance-sheet changes to the planned plant.
At H1FY27, consolidated equity stood at Rs 100.60 crore, compared with Rs 96.11 crore at FY26. Long-term borrowings increased to Rs 11.31 crore from Rs 7.81 crore, while short-term borrowings were Rs 21.80 crore compared with Rs 21.90 crore. The supplied presentation does not include a standalone H1FY27 income statement.
Conclusion
Energy-Mission's three-year standalone record separates revenue growth from margin progression. Revenue increased from Rs 126.29 crore in FY24 to Rs 159.08 crore in FY26, while EBITDA margin declined from 15.46% to 13.41% and PAT margin fell from 8.68% to 7.01%. FY26 PAT of Rs 11.16 crore was below FY25's Rs 12.57 crore but remained above FY24's Rs 10.97 crore.
The next disclosures to watch are the scheduled FY 2026-27 commissioning of the EM Press Form plant, the use of 1,500 machines of annual capacity and conversion of the Rs 47.23 crore order book. The presentation leaves unresolved the specific drivers of the standalone margin decline and whether the shorter two-to-three-month manufacturing cycle changes future cost or revenue timing.