










Energy-Mission standalone PAT rose 21.4%, consolidated PAT fell 18.6%
Key highlights
- Energy-Mission’s H1FY27 standalone PAT rose 21.4% half on half to Rs 5.54 crore.
- Energy-Mission’s H1FY27 consolidated PAT fell 18.6% half on half to Rs 4.49 crore.
- Standalone EBITDA margin rose to 13.27%, while consolidated EBITDA margin fell to 12.36%.
- H1FY27 orders received increased 16% year on year to Rs 91.55 crore and the order book reached Rs 62.27 crore.
powered by IRIS
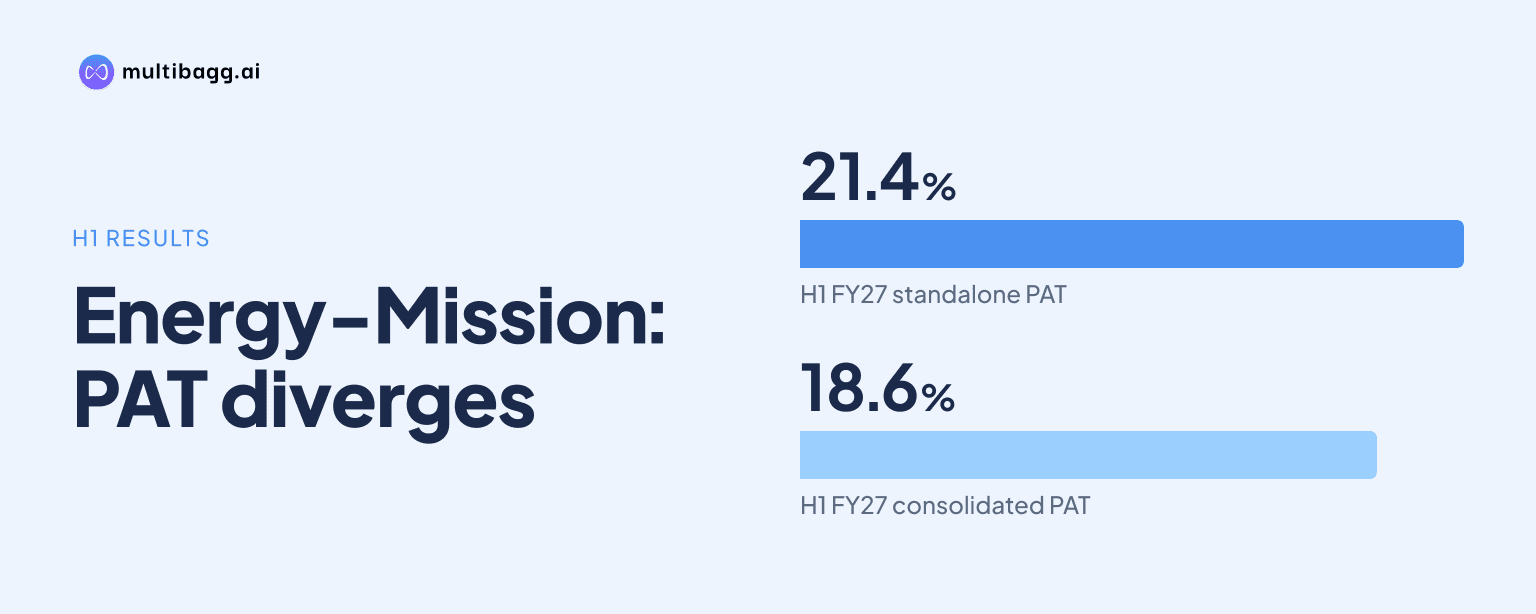
Energy-Mission Machineries (India) Ltd reported H1FY27 standalone profit after tax of Rs 5.54 crore, up 21.4% from H2FY26, while consolidated profit after tax was Rs 4.49 crore, down 18.6%. The divergence reflected lower standalone expenditure and a higher operating margin, against declining consolidated operating profit and margin.
Know Energy-Mission Machineries (India) inside out
Results, valuation, peers and who's buying, in one view.
Why did Energy-Mission’s standalone and consolidated profits diverge?
Energy-Mission’s standalone and consolidated results diverged because standalone costs fell faster than revenue, while consolidated revenue, operating profit and net margin all declined in H1FY27. Standalone revenue from operations was Rs 80.26 crore, 4.1% below Rs 83.73 crore in H2FY26. Total expenditure declined 5.7% to Rs 69.61 crore from Rs 73.78 crore, allowing earnings before interest, tax, depreciation and amortisation, or EBITDA, to increase 7.1% to Rs 10.65 crore.
At the consolidated level, revenue declined 4.9% sequentially to Rs 80.86 crore from Rs 85 crore, while total expenditure fell 3.9% to Rs 70.87 crore. EBITDA therefore decreased 11.5% to Rs 9.99 crore from Rs 11.29 crore. Consolidated profit after tax, or PAT, was also below the standalone Rs 5.54 crore result at Rs 4.49 crore. The presentation provides both statements but does not specify the consolidation adjustments behind the Rs 1.05 crore difference.
What improved in Energy-Mission’s standalone H1FY27 earnings?
Energy-Mission’s standalone earnings improved sequentially because cost reductions more than offset the Rs 3.47 crore decline in revenue from H2FY26. EBITDA margin expanded to 13.27% in H1FY27 from 11.88% in H2FY26, an increase of 1.39 percentage points. Profit before interest and tax, or PBIT, rose 8.8% to Rs 8.82 crore, while profit before tax increased 11.7% to Rs 7.46 crore.
Management attributed the cost movement to a 13.6% half-on-half reduction in other expenses, led by lower external job work after a new subsidiary commenced operations in July 2026. Employee benefit expenses declined 18.9% half on half under tighter manpower cost control. Interest expense also declined 4.8% to Rs 1.36 crore and tax fell 9.1% to Rs 1.92 crore, helping PAT margin rise to 6.90% from 5.45%.
The sequential improvement did not extend to the year-on-year comparison. H1FY27 standalone revenue of Rs 80.26 crore was 6.5% above H1FY26 revenue of Rs 75.35 crore, but EBITDA of Rs 10.65 crore was 6.5% lower than Rs 11.38 crore a year earlier. Standalone PAT declined 16.1% year on year from Rs 6.6 crore, while earnings per share fell to Rs 4.89 from Rs 5.82.
Got a follow-up? Ask IRIS
Why did Energy-Mission’s consolidated margin decline in H1FY27?
Energy-Mission’s consolidated margin declined because the 4.9% sequential revenue contraction exceeded the 3.9% reduction in total expenditure. Consolidated EBITDA margin was 12.36% in H1FY27, compared with 13.28% in H2FY26, a decline of 0.92 percentage points. This contrasted with the standalone EBITDA margin increase of 1.39 percentage points over the same periods.
Consolidated PBIT fell 15.7% half on half to Rs 7.88 crore from Rs 9.35 crore. Other income declined to Rs 5 lakh from Rs 27 lakh, while depreciation was Rs 2.16 crore compared with Rs 2.2 crore. Interest expense reduced to Rs 1.37 crore from Rs 1.43 crore, but lower operating profit and other income meant profit before tax fell 17.6% to Rs 6.52 crore.
The decline was also evident against H1FY26. Consolidated EBITDA was down 11.0% from Rs 11.23 crore and its margin fell from 14.81% to 12.36%. Consolidated PAT declined 30.1% year on year from Rs 6.42 crore, while earnings per share decreased to Rs 3.95 from Rs 5.67. The presentation does not identify particular subsidiary costs, revenue timing or other consolidation effects behind these changes.
What operating mix and order flow support Energy-Mission’s next period?
Energy-Mission’s H1FY27 revenue mix was led by hydraulic press brake machines, which accounted for 73.1% of product revenue. Hydraulic shearing machines contributed 15.4%, machinery parts and others contributed 5.1%, and hydraulic plate rolling machines contributed 4.0%. Hydraulic sigma, or iron, machines accounted for 1.5%, while hydraulic press machines accounted for 0.5%, leaving the reported mix concentrated in press brakes.
Gujarat accounted for 19.3% of H1FY27 revenue and Maharashtra for 17.2%, followed by Uttar Pradesh at 7.4%, Tamil Nadu at 7.0% and Karnataka at 6.7%. The five states represented about 59% of revenue, while other states accounted for 38.8%. Export sales from the United States, United Arab Emirates and Nepal represented about 3%, and Energy-Mission reported sales in more than 20 states.
Order inflow provides a separate measure of future execution activity. Orders received rose 16% year on year to Rs 91.55 crore in H1FY27 from Rs 79.17 crore in H1FY26, and exceeded Rs 71.52 crore in H2FY26. With Rs 76.5 crore of orders executed during H1FY27, the unexecuted order book rose to Rs 62.27 crore from Rs 47.23 crore at the end of H2FY26. Management said H1 order booking provides a foundation for H2 execution, but did not state a revenue or profit target.
Conclusion
Energy-Mission’s H1FY27 statements show opposing sequential earnings outcomes: standalone PAT rose 21.4% to Rs 5.54 crore as total expenditure declined 5.7%, while consolidated PAT fell 18.6% to Rs 4.49 crore as EBITDA decreased 11.5%. Margin direction also differed, with standalone EBITDA margin at 13.27% and consolidated EBITDA margin at 12.36%.
The next reported period will show whether the Rs 62.27 crore unexecuted order book converts into revenue and whether the standalone cost reductions continue after the subsidiary’s July 2026 start. The difference between standalone and consolidated PAT also remains relevant because the presentation reports the gap but does not disclose the specific consolidation factors behind it.