










Maxposure revenue rose 86% as FY26 EBITDA margin fell
Key highlights
- Maxposure’s FY26 revenue was Rs 88.02 crore, about 86% above Rs 47.28 crore in FY24.
- Calculated EBITDA margin declined from 24.09% in FY24 to 15.44% in FY26.
- Maxposure reported H1 FY27 EBITDA of Rs 4.12 crore and a disclosed EBITDA margin of 9.66%.
- FY26 profit after tax was Rs 9.48 crore, about 17% above Rs 8.11 crore in FY24.
powered by IRIS
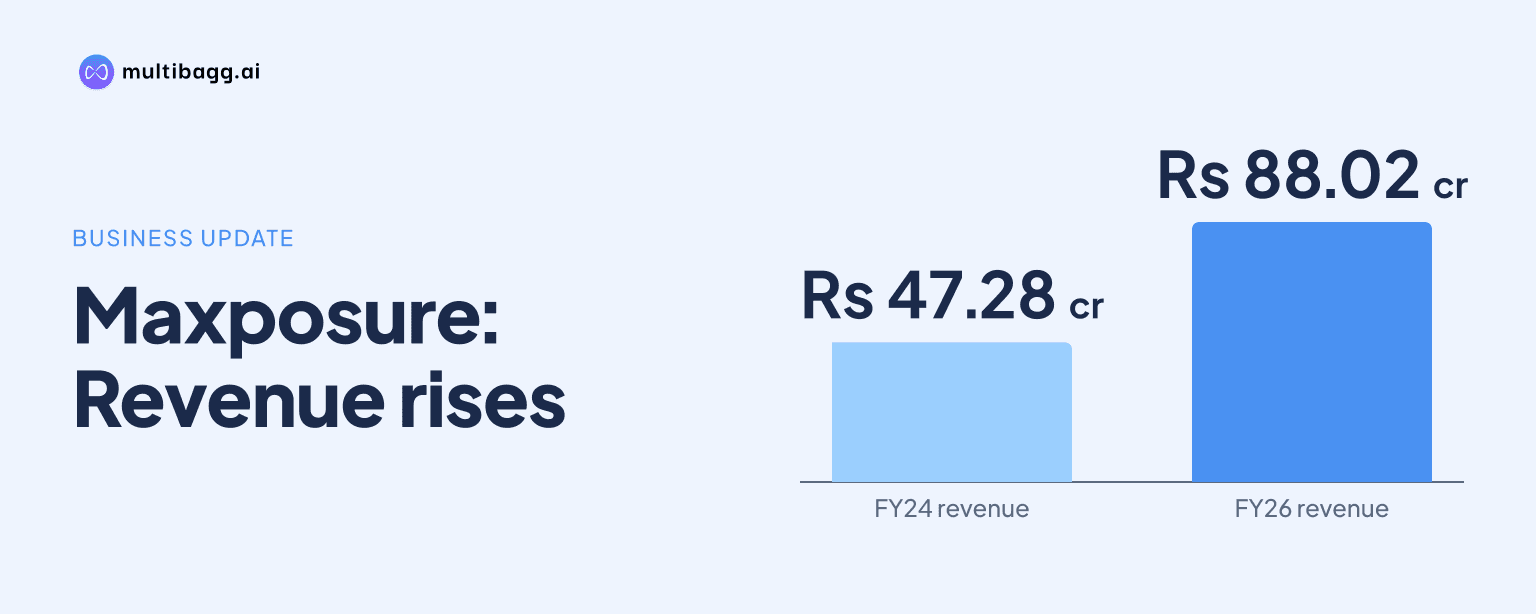
Maxposure Limited increased consolidated revenue by about 86% to Rs 88.02 crore in FY26 from Rs 47.28 crore in FY24, but its EBITDA margin, calculated on total income, declined to 15.44% from 24.09%. Maxposure then reported a 9.66% EBITDA margin on Rs 42.66 crore of total income in H1 FY27.
Know Maxposure inside out
Results, valuation, peers and who's buying, in one view.
How fast did Maxposure revenue grow through FY26?
Maxposure’s consolidated revenue rose in each of the three financial years disclosed, reaching Rs 88.02 crore in FY26 from Rs 63.28 crore in FY25 and Rs 47.28 crore in FY24. FY26 revenue was Rs 24.74 crore higher than FY25 and Rs 40.75 crore higher than FY24. The two-year revenue increase was materially larger than the rise in EBITDA over the same period.
Maxposure’s total income, which includes revenue and other income, increased from Rs 48.14 crore in FY24 to Rs 88.76 crore in FY26. Other income did not move in line with revenue: it rose to Rs 1.35 crore in FY25 from Rs 86.67 lakh in FY24, then fell to Rs 73.52 lakh in FY26. The annual EBITDA-margin figures in the table are calculations using disclosed EBITDA and total income, rather than separately reported annual margin figures.
Why did Maxposure’s EBITDA margin decline in FY26?
Maxposure’s EBITDA increased by about 18% from Rs 11.60 crore in FY24 to Rs 13.70 crore in FY26, compared with revenue growth of about 86%. Total expenditure rose to Rs 75.06 crore in FY26 from Rs 36.55 crore in FY24, while total income increased to Rs 88.76 crore from Rs 48.14 crore. That difference reduced calculated EBITDA margin by 8.65 percentage points over the two years.
Raw-material expense was the largest FY26 cost line at Rs 53.64 crore, compared with Rs 26.23 crore in FY24. Employee costs more than doubled to Rs 13.36 crore from Rs 5.99 crore, while other expenses increased to Rs 8.06 crore from Rs 4.33 crore. Raw materials represented about 60.4% of FY26 total income, up from about 54.5% in FY24, and employee costs represented about 15.1%, up from about 12.4%.
The presentation provides the FY24-to-FY26 expense movements but does not give a management explanation for the higher cost shares. The difference between revenue growth and EBITDA growth is therefore a reported financial outcome rather than evidence of a specified operational cause. In FY26, raw materials alone rose by Rs 27.41 crore from FY24, exceeding the Rs 2.10 crore increase in EBITDA.
What does H1 FY27 show about Maxposure’s margins?
Maxposure reported H1 FY27 EBITDA of Rs 4.12 crore on total income of Rs 42.66 crore, producing the disclosed EBITDA margin of 9.66%. Net sales were Rs 41.84 crore and other income was Rs 82.04 lakh. Total expenditure was Rs 38.54 crore, leaving profit before tax of Rs 3.17 crore and net profit of Rs 2.77 crore.
H1 FY27 cost of material and direct expenses was Rs 26.52 crore, employee-benefit expense was Rs 6.88 crore and other expenses were Rs 5.13 crore. Cost of material and direct expenses represented about 62.2% of H1 FY27 total income. This is above raw materials’ approximately 60.4% share of FY26 total income, although the presentation uses different cost labels for the half-year and annual statements.
The disclosed H1 FY27 EBITDA margin of 9.66% was 5.78 percentage points below the calculated FY26 margin of 15.44%. However, the presentation does not provide an H1 FY26 income statement or margin, preventing a like-for-like half-year comparison. The H1 FY27 statement also reports a 6.49% net profit margin on net profit of Rs 2.77 crore.
Got a follow-up? Ask IRIS
Did Maxposure’s profit rise as quickly as sales?
Maxposure’s profit after tax rose to Rs 9.48 crore in FY26 from Rs 8.50 crore in FY25 and Rs 8.11 crore in FY24. The FY24-to-FY26 increase was about 17%, substantially below the roughly 86% increase in revenue. In FY26 alone, profit after tax increased by Rs 97.42 lakh from FY25, while revenue increased by Rs 24.74 crore.
Profit before tax was Rs 11.81 crore in FY26, compared with Rs 11.00 crore in FY25 and Rs 11.42 crore in FY24. The FY24 reported figure included Rs 88.47 lakh of exceptional items, while profit before tax before exceptional items was Rs 10.54 crore. This means the reported FY24 profit-before-tax result is not directly comparable with periods that show no exceptional item.
Below EBITDA, finance costs increased to Rs 98.66 lakh in FY26 from Rs 31.46 lakh in FY25 and Rs 52.18 lakh in FY24. Depreciation rose to Rs 90.73 lakh in FY26 from Rs 76.28 lakh in FY25 and Rs 53.75 lakh in FY24. In H1 FY27, interest was Rs 47.28 lakh and depreciation was Rs 47.94 lakh, compared with EBITDA of Rs 4.12 crore.
What balance-sheet and return measures accompanied FY26 earnings?
Maxposure reported return on equity of 11.99% in FY26, compared with 11.27% in FY25 and 14.31% in FY24. Return on capital employed was 14.28% in FY26, up from 13.59% in FY25 and 13.95% in FY24. Earnings per share increased to Rs 4.17 in FY26 from Rs 3.74 in FY25 and Rs 3.56 in FY24.
The current ratio was 2.09 times in FY26, versus 1.91 times in FY25 and 2.62 times in FY24. Debt to equity increased to 0.14 times from 0.11 times in FY25 and 0.03 times in FY24. Short-term borrowings were Rs 9.80 crore in FY26, compared with Rs 7.01 crore in FY25 and Rs 33.55 lakh in FY24.
Trade receivables increased to Rs 25.21 crore in FY26 from Rs 23.73 crore in FY25 and Rs 19.86 crore in FY24. At the same time, receivable turnover rose to 3.49 times from 2.67 times in FY25 and 2.38 times in FY24. Cash and bank balances declined to Rs 13.80 crore in FY26 from Rs 14.85 crore in FY25, while total current assets increased to Rs 54.12 crore.
Conclusion
Maxposure’s FY24-to-FY26 financial record shows a widening gap between sales growth and operating-profit growth. Revenue added Rs 40.75 crore across the two years, while EBITDA added Rs 2.10 crore and profit after tax added Rs 1.37 crore. Higher raw-material and employee-cost shares coincided with the calculated annual EBITDA-margin decline from 24.09% to 15.44%.
The next disclosure should clarify whether the H1 FY27 EBITDA margin of 9.66% persists through the full year, particularly as cost of material and direct expenses were Rs 26.52 crore in the half year. The presentation provides neither an H1 FY26 comparator nor a full-year FY27 margin target or outlook, leaving the trajectory of cost mix and full-year profitability unresolved.