










Entero revenue reached Rs 6,591.2 crore as EBITDA margin hit 4%
Key highlights
- Entero’s FY26 revenue was Rs 6,591.2 crore, compared with Rs 2,522.1 crore in FY22.
- Entero’s EBITDA margin increased from 1.0% in FY22 to 4.0% in FY26.
- Entero reported FY26 profit after tax of Rs 145.8 crore after a Rs 29.4 crore loss in FY22.
- Entero operated 136 warehouses in FY26, compared with 74 in FY23.
powered by IRIS
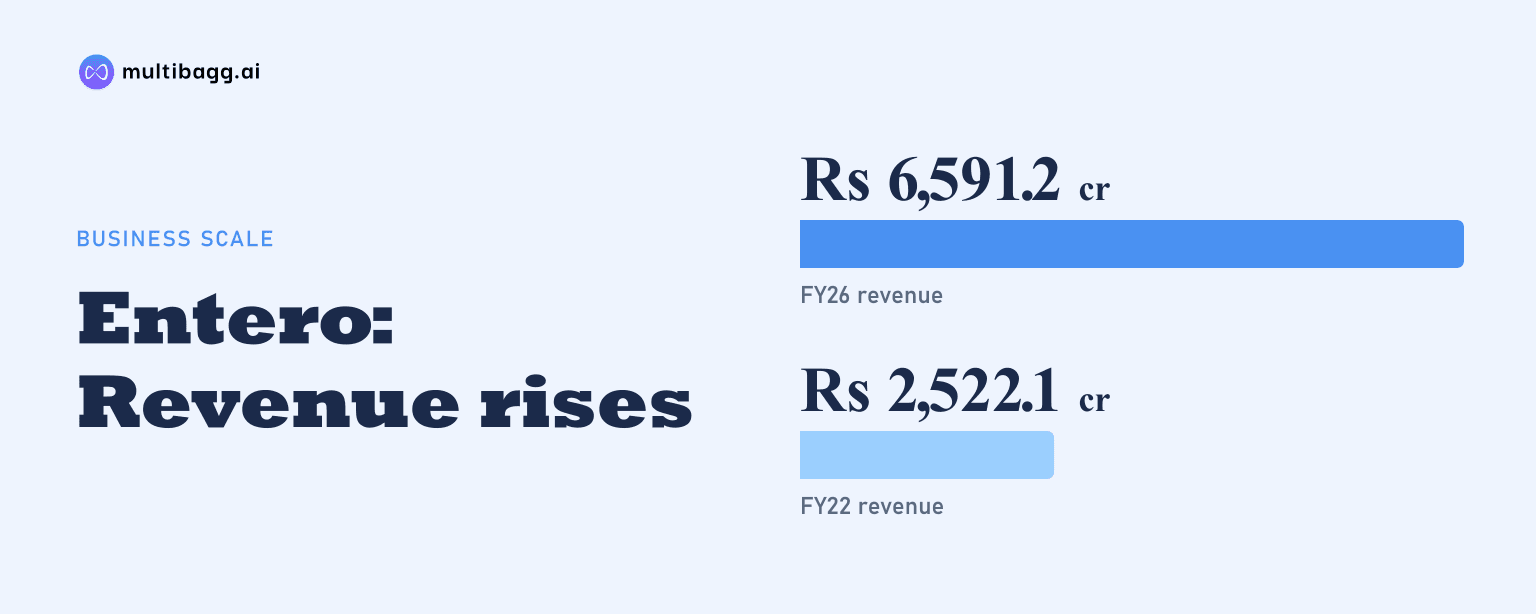
Entero Healthcare Solutions Limited increased consolidated revenue to Rs 6,591.2 crore in FY26 from Rs 2,522.1 crore in FY22, while EBITDA margin reached 4.0% from 1.0%. Gross margin also increased to 10.3% from 8.3%, and profit after tax changed from a Rs 29.4 crore loss to a Rs 145.8 crore profit.
Know Entero Healthcare Solutions inside out
Results, valuation, peers and who's buying, in one view.
How fast did Entero’s revenue grow through FY26?
Entero’s revenue increased by Rs 4,069.1 crore between FY22 and FY26, reaching Rs 6,591.2 crore from Rs 2,522.1 crore. The financial-highlights page shows a 27% revenue compound annual growth rate, while the longer historical series records revenue of Rs 293 crore in FY19, identified as the first year of operations.
Revenue increased in each reported year, although the annual increase varied. It rose by Rs 778.1 crore in FY23, Rs 622.1 crore in FY24, Rs 1,173.5 crore in FY25 and Rs 1,495.4 crore in FY26. The FY26 increase was the largest absolute annual rise in the FY22-to-FY26 series.
Entero expanded several operating measures alongside revenue. Retail customers rose from more than 81,400 in FY23 to more than 105,300 in FY26, manufacturer relationships grew from more than 1,900 to more than 3,300, and warehouses increased from 74 to 136. Stock-keeping units, or SKUs, handled increased from more than 64,500 to more than 97,500.
What changed in Entero’s gross and EBITDA margins?
Entero’s gross margin increased by 2.0 percentage points to 10.3% in FY26 from 8.3% in FY22, while EBITDA margin increased by 3.0 percentage points to 4.0% from 1.0%. Earnings before interest, tax, depreciation and amortisation, or EBITDA, rose by Rs 241.6 crore to Rs 266.0 crore over the period.
The gross-margin progression was not uniform. Gross margin declined to 8.1% in FY23 before increasing to 9.0% in FY24, 9.5% in FY25 and 10.3% in FY26. EBITDA margin increased in every year shown, rising from 1.0% in FY22 to 1.9%, 2.9%, 3.4% and 4.0% over the following four financial years.
Entero’s cost lines rose in rupee terms as the business grew. Employee expenses increased to Rs 241.9 crore in FY26 from Rs 114.8 crore in FY22, while other expenses rose to Rs 168.9 crore from Rs 70.4 crore. Gross profit increased by Rs 470.8 crore to Rs 680.4 crore over the same interval, exceeding the Rs 241.6 crore increase in EBITDA.
Did Entero become profitable after tax?
Entero became profitable after tax in FY24, reporting profit after tax of Rs 39.8 crore after losses of Rs 29.4 crore in FY22 and Rs 11.0 crore in FY23. Profit after tax then rose to Rs 107.4 crore in FY25 and Rs 145.8 crore in FY26, producing three consecutive profitable financial years in the disclosed series.
Profit before tax followed the same direction, moving from losses of Rs 19.8 crore in FY22 and Rs 3.6 crore in FY23 to profit of Rs 35.6 crore in FY24. In FY26, profit before tax was Rs 179.3 crore after finance costs of Rs 43.9 crore, depreciation of Rs 15.0 crore and lease-rental-related expenses of Rs 38.8 crore across two listed expense lines.
The FY26 profit-and-loss statement includes Rs 8.2 crore of exceptional items, which Entero identifies as a one-off impact of India’s New Labour Code. Other income declined to Rs 18.2 crore in FY26 from Rs 38.9 crore in FY25, while tax expense increased to Rs 33.5 crore from Rs 31.3 crore. These items help explain the difference between EBITDA and profit after tax.
Got a follow-up? Ask IRIS
How did working capital and cash flow change in FY26?
Entero’s net operating working capital was 68 days in FY26, compared with 71 days in FY22 and 70 days in FY25. The company defines the measure as trade receivables plus inventories less trade payables, divided by operating revenue including goods and services tax, or GST, divided by 365.
Balance-sheet operating items increased in FY26. Inventories rose to Rs 841.7 crore at March 2026 from Rs 659.8 crore at March 2025, while trade receivables rose to Rs 1,212.4 crore from Rs 830.4 crore. Trade payables also increased to Rs 725.3 crore from Rs 397.3 crore, alongside FY26 revenue of Rs 6,591.2 crore.
Net cash from operating activities turned positive at Rs 96.2 crore in FY26, compared with an outflow of Rs 76.9 crore in FY25 and an outflow of Rs 35.3 crore in FY22. Net cash used in investing activities was Rs 303.0 crore in FY26, and cash and cash equivalents ended the year at Rs 146.9 crore, down from Rs 229.3 crore at FY25-end.
What operational expansion supported Entero’s financial growth?
Entero reported 51 acquisitions since inception through calendar year 2026, including 10 acquisitions in calendar year 2024, six in 2025 and one in 2026. Its stated acquisition strategy is a pan-India approach to buying and integrating smaller distributors as the market consolidates.
The distribution network reached 136 warehouses and 523 districts in FY26, compared with 74 warehouses and 495 districts in FY23. In Q1FY27, Entero reported distribution to more than 72,000 pharmacies and more than 2,300 hospitals through demand-fulfilment activities covering pharmaceuticals, medical devices, surgical consumables, over-the-counter products, nutraceuticals and vaccines.
Management lists strategic acquisitions, customer wallet share, geographic penetration, manufacturer collaborations, technology investment and private-label expansion as growth drivers. Entero’s technology platform provides visibility on inventory, pricing, order status and promotional offers, while its stated hub-and-spoke model links warehouses and supply points.
Conclusion
Entero’s FY22-to-FY26 record combines a Rs 4,069.1 crore increase in revenue with gross-margin expansion from 8.3% to 10.3% and EBITDA-margin expansion from 1.0% to 4.0%. The change in operating profitability was accompanied by profit after tax of Rs 145.8 crore in FY26, compared with a Rs 29.4 crore loss in FY22, while working capital remained at 68 days.
Next, readers can track management’s disclosed plan to pursue acquisitions, widen customer and geographic reach, build manufacturer collaborations, invest in technology and expand private-label and service offerings. The next operating datapoint disclosed in the presentation is Q1FY27 distribution to more than 72,000 pharmacies and more than 2,300 hospitals, while the integration of acquisitions remains a key matter to follow.