










Finolex Q2 PVC/EDC Delta Fell $80 a Tonne Year on Year
Key highlights
- Finolex’s average PVC/EDC delta fell $80 per metric tonne year on year to $455 in Q2 FY27 from $535 in Q2 FY26.
- Finolex’s Q2 FY27 sales volumes rose 28% year on year to 83,407 MT, while revenue increased 28% to Rs 1,094 crore.
- Finolex’s Q2 FY27 EBITDA declined to Rs 124 crore from Rs 130 crore as materials consumed increased Rs 245 crore, exceeding the Rs 235 crore revenue increase.
- Finolex reported H1 FY27 net free cash of about Rs 2,584 crore and maintained an EBITDA margin of about 12%.
powered by IRIS
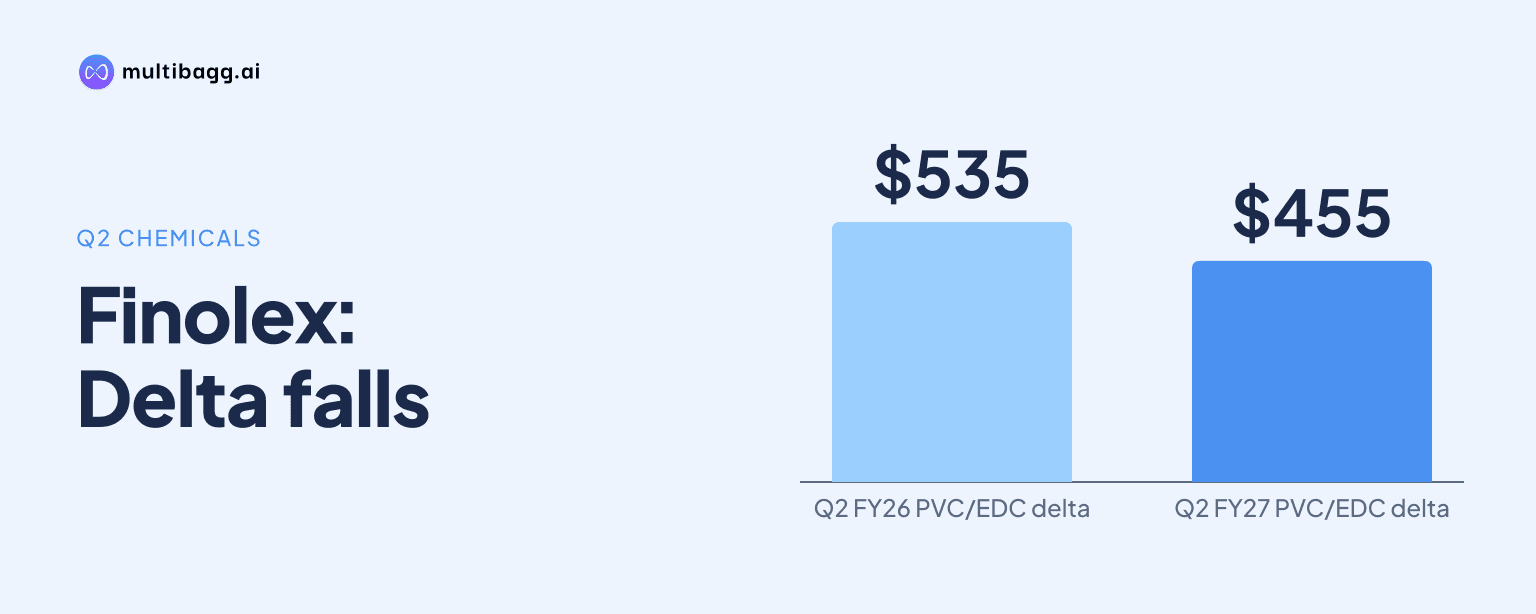
Finolex Industries Limited, referred to here as Finolex, reported that its average PVC/EDC delta declined by $80 per metric tonne year on year to $455 in Q2 FY27 from $535 in Q2 FY26. The lower delta coincided with EBITDA falling to Rs 124 crore from Rs 130 crore despite sales-volume growth of 28%.
Know Finolex Industries inside out
Results, valuation, peers and who's buying, in one view.
How much did Finolex's PVC/EDC delta change in Q2 FY27?
Finolex's average PVC/EDC delta narrowed by $80 per metric tonne, or about 15%, from $535 in Q2 FY26 to $455 in Q2 FY27. The presentation showed the delta alongside average polyvinyl chloride (PVC) prices, while identifying ICIS reports as the source of the market data. The company did not provide a separate calculation of the earnings effect of the change in the PVC/EDC measure.
Average PVC pricing increased by $34 per metric tonne to $771 in Q2 FY27 from $737 in Q2 FY26, even as the PVC/EDC delta moved lower. This contrast occurred in a quarter in which Finolex said higher material costs offset the benefit of volume growth. The disclosed numbers establish the direction of the market movement and its timing alongside cost pressure, rather than attributing a specific rupee impact to the $80 change.
Why did Finolex's EBITDA decline despite higher Q2 sales?
Finolex's Q2 FY27 earnings before interest, tax, depreciation and amortisation (EBITDA) declined by Rs 6 crore because the Rs 245 crore increase in materials consumed exceeded the Rs 235 crore increase in revenue. Revenue rose to Rs 1,094 crore in Q2 FY27 from Rs 859 crore in Q2 FY26, while EBITDA fell to Rs 124 crore from Rs 130 crore. Finolex described operating performance as flattish and said higher material costs of 13% offset volume growth.
The quarterly EBITDA bridge lists materials consumed as the largest adverse movement, at Rs 245 crore, against the Rs 235 crore revenue increase. Employee benefit expenses added Rs 5 crore and other expenses reduced EBITDA by Rs 1 crore. Together, these movements reconcile the decline from Rs 130 crore in Q2 FY26 to Rs 124 crore in Q2 FY27.
Earnings before interest and tax (EBIT) fell 6% year on year to Rs 96 crore in Q2 FY27 from Rs 103 crore in Q2 FY26. Profit before tax (PBT) declined 3% to Rs 153 crore from Rs 158 crore. The business-performance table labels its Q2 FY27 financial and operating figures as standalone, covering the revenue, EBIT and PBT comparisons.
Got a follow-up? Ask IRIS
How did Finolex's Q2 FY27 compare with Q1 FY27 and Q2 FY26?
Finolex's Q2 FY27 sales volumes reached 83,407 metric tonnes (MT), up 28% from 65,336 MT in Q2 FY26 and 23% from 67,699 MT in Q1 FY27. Revenue similarly increased 28% year on year to Rs 1,094 crore and 24% sequentially from Rs 884 crore in Q1 FY27. Q2 FY27 was therefore larger than both comparison periods in volume and revenue.
Profit measures did not follow the same year-on-year pattern as revenue. EBIT increased 22% from Rs 79 crore in Q1 FY27 to Rs 96 crore in Q2 FY27, but remained below Rs 103 crore in Q2 FY26. PBT rose 4% sequentially from Rs 148 crore, while remaining below the Rs 158 crore recorded a year earlier.
What does Finolex's first-half performance show about costs and volumes?
Finolex reported H1 FY27 revenue of Rs 1,978 crore, up 4% from Rs 1,902 crore in H1 FY26, although sales volumes declined 4% to 151,106 MT from 157,465 MT. The company attributed the revenue increase to improved realisations and healthy Q2 FY27 volume growth. The Q2 increase partly offset the decline in Q1 but did not eliminate the first-half volume shortfall.
EBIT increased 3% to Rs 175 crore in H1 FY27 from Rs 170 crore a year earlier, while PBT rose 6% to Rs 300 crore from Rs 284 crore. EBITDA was Rs 231 crore in H1 FY27 versus Rs 223 crore in H1 FY26, and Finolex said its EBITDA margin was maintained at about 12%. The six-month comparison therefore differed from Q2, when EBITDA and PBT were lower year on year.
The H1 EBITDA bridge also identified materials as the principal offset to revenue growth. It showed Rs 76 crore of additional revenue against Rs 82 crore of additional materials consumed, with Rs 8 crore from employee benefit expenses and Rs 6 crore from other expenses, taking EBITDA from Rs 224 crore to Rs 231 crore. The bridge's opening figure differs by Rs 1 crore from the Rs 223 crore comparative in the business-performance summary, and the presentation does not explain the difference.
Conclusion
Finolex reported a Q2 FY27 PVC/EDC delta of $455 per metric tonne, $80 below the Q2 FY26 average of $535, while average PVC prices rose by $34 to $771 per metric tonne. Sales volumes rose 28% and revenue increased by Rs 235 crore, but EBITDA fell by Rs 6 crore as materials consumed increased by Rs 245 crore in the quarterly bridge.
The next reported PVC/EDC averages and materials-consumed line will indicate whether the Q2 cost pressure changes after H1 FY27 volumes remained 4% below H1 FY26 at 151,106 MT. Finolex reported net free cash of about Rs 2,584 crore and an H1 EBITDA margin of about 12%, but disclosed no future PVC/EDC delta target, materials-cost target or earnings guidance.