










Finolex Q2 volume rises 28% while EBITDA falls to Rs 124 crore
Key highlights
- Finolex Industries’ Q2 FY27 sales volume rose 28% year on year to 83,407 MT.
- Q2 FY27 revenue increased to Rs 1,094 crore from Rs 859 crore, while EBITDA declined to Rs 124 crore from Rs 130 crore.
- H1 FY27 volume fell 4% to 151,106 MT, but revenue rose 4% to Rs 1,978 crore and EBITDA increased to Rs 231 crore.
- Finolex reported net free cash of about Rs 2,584 crore in Q2 FY27, without providing a stated deployment plan.
powered by IRIS
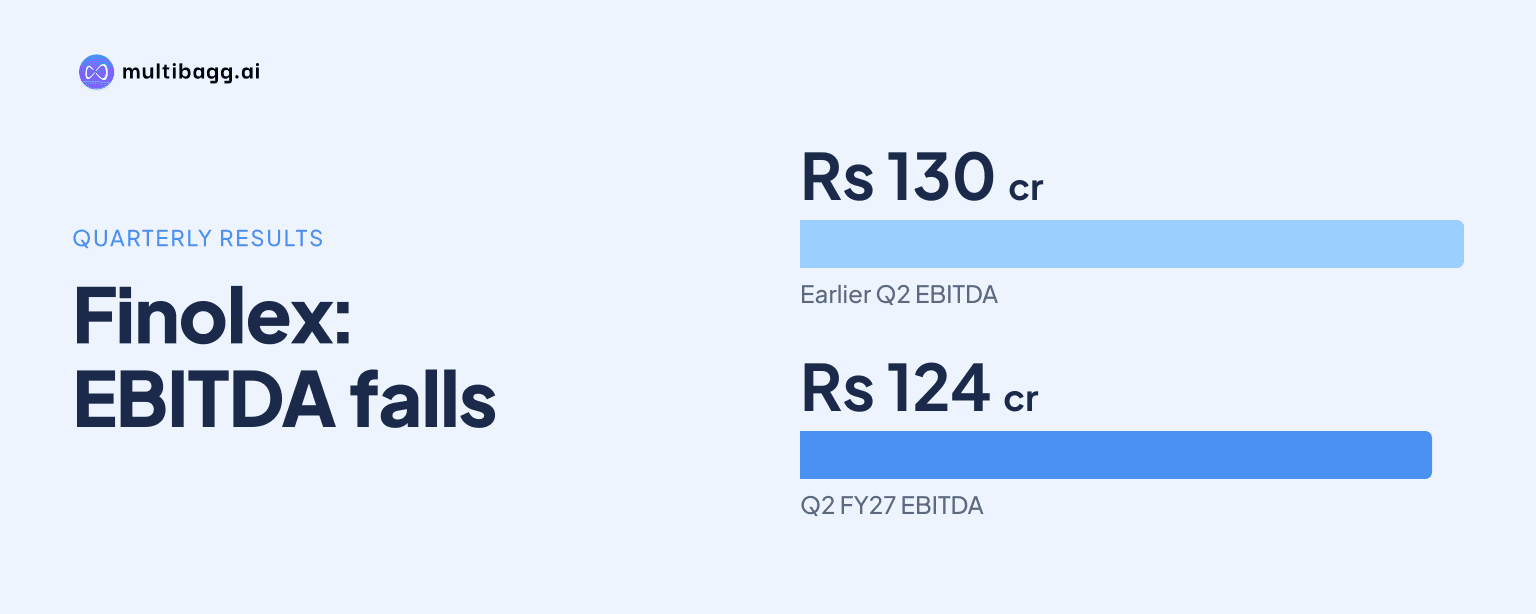
Finolex Industries Limited reported Q2 FY27 sales volume of 83,407 metric tonnes (MT), 28% above Q2 FY26, but earnings before interest, tax, depreciation and amortisation (EBITDA) fell Rs 6 crore to Rs 124 crore. Its EBITDA bridge shows materials consumed increased Rs 245 crore, exceeding the Rs 235 crore revenue contribution.
Know Finolex Industries inside out
Results, valuation, peers and who's buying, in one view.
How did Finolex's Q2 sales volume and revenue change?
Finolex's Q2 FY27 sales volume rose 28% year on year to 83,407 MT from 65,336 MT in Q2 FY26. It also rose 23% from 67,699 MT in Q1 FY27, a sequential increase of 15,708 MT that lifted second-quarter volume above both comparison periods.
Finolex reported Q2 FY27 revenue of Rs 1,094 crore, compared with Rs 859 crore in Q2 FY26 and Rs 884 crore in Q1 FY27. The increase was Rs 235 crore year on year and Rs 210 crore sequentially; the performance summary calls the year-on-year revenue growth 27%, while the detailed Q2 table labels it 28%.
The Q2 increase did not reverse the first-half volume decline. H1 FY27 volume was 151,106 MT, down 4% from 157,465 MT in H1 FY26, while revenue increased 4% to Rs 1,978 crore from Rs 1,902 crore. Finolex attributed the higher H1 revenue despite lower volume to improved realisations and healthy Q2 FY27 volume growth.
Why did Finolex's EBITDA fall despite higher Q2 volume?
Finolex's Q2 FY27 EBITDA fell to Rs 124 crore from Rs 130 crore because the Rs 245 crore increase in materials consumed was Rs 10 crore larger than the Rs 235 crore revenue contribution. The bridge also records a Rs 5 crore benefit from employee benefit expenses and a Rs 1 crore adverse movement in other expenses, resulting in the Rs 6 crore EBITDA decline.
The volume and revenue gains therefore did not produce higher year-on-year operating profit in Q2 FY27. EBIT fell 6% to Rs 96 crore from Rs 103 crore, and PBT declined 3% to Rs 153 crore from Rs 158 crore, although both measures rose from Q1 FY27 levels of Rs 79 crore and Rs 148 crore respectively.
Finolex described Q2 FY27 operating performance as flattish, citing higher material costs of 13% that offset the volume benefit. Average polyvinyl chloride, or PVC, price was USD 771 per MT in Q2 FY27 versus USD 737 per MT in Q2 FY26, while the PVC/ethylene dichloride, or EDC, delta fell to USD 455 per MT from USD 535 per MT.
Got a follow-up? Ask IRIS
How did Finolex's first-half profitability compare with last year?
Finolex reported H1 FY27 EBITDA of Rs 231 crore, versus Rs 223 crore in H1 FY26, while saying EBITDA margin was maintained at about 12%. This differed from Q2 FY27, when EBITDA was Rs 6 crore below the prior-year quarter despite a 28% increase in sales volume.
The H1 EBITDA bridge starts from Rs 224 crore in FY26, rather than the Rs 223 crore in the business-performance summary, and reaches Rs 231 crore. It shows a Rs 76 crore revenue benefit offset by Rs 82 crore higher materials consumed, with Rs 8 crore from employee benefit expenses and Rs 6 crore from other expenses; the presentation does not explain the Rs 1 crore difference in its H1 FY26 EBITDA starting figures.
H1 FY27 EBIT increased 3% to Rs 175 crore from Rs 170 crore, while PBT increased 6% to Rs 300 crore from Rs 284 crore. Revenue growth of 4% alongside a 4% volume decline indicates that the half-year revenue outcome differed from sales volume, which Finolex linked to improved realisations and Q2 volume growth.
What do Finolex's PVC and liquidity disclosures show?
Finolex's reported PVC price rose by USD 34 per MT year on year in Q2 FY27, while the PVC/EDC delta declined by USD 80 per MT. These market measures accompany the company's disclosure that higher material costs offset Q2 volume growth, but the presentation does not specify a direct formula linking either measure to the Rs 245 crore materials-consumed movement.
Finolex reported net free cash of about Rs 2,584 crore in Q2 FY27 and described its liquidity as strong. The presentation provides neither a Q2 FY26 or Q1 FY27 comparison for free cash nor a breakdown of the calculation, capital-expenditure target, debt-repayment plan, dividend plan or stated use for that amount.
The Q2 sales-volume, revenue, EBIT and PBT table is marked as standalone, covering Rs 1,094 crore of revenue and Rs 153 crore of PBT in Q2 FY27. The investor presentation was issued for unaudited standalone and consolidated results for the quarter and half year ended September 30, 2026, but its detailed Q2 performance table specifies the standalone basis.
Conclusion
Finolex's Q2 FY27 result combined a substantial sales recovery with lower operating profit: volume reached 83,407 MT and revenue reached Rs 1,094 crore, while EBITDA fell to Rs 124 crore. The Rs 245 crore rise in materials consumed exceeded the Rs 235 crore revenue contribution, whereas H1 FY27 still recorded higher revenue, EBIT and PBT despite a 4% decline in volume.
The unresolved issue is whether future volume gains can offset or be accompanied by lower material-cost pressure, given the Q2 movement in PVC pricing and the PVC/EDC delta. Finolex disclosed no forward volume, margin, capital-spending or cash-deployment target in this presentation, so it provides no scheduled operating milestone beyond subsequent financial disclosures.