










Flair operating cash flow fell 42% to Rs 32.2 crore in H1
Key highlights
- Flair’s net cash from operating activities fell 42% to Rs 32.2 crore in H1 FY27 from Rs 55.8 crore in H1 FY26.
- Flair’s inventories increased Rs 39.3 crore to Rs 393.3 crore between March 2026 and September 2026.
- Flair’s trade receivables increased Rs 58.1 crore to Rs 331.5 crore between March 2026 and September 2026.
- Flair’s H1 FY27 revenue rose 8.2% to Rs 659.4 crore, while EBITDA declined 5.5% to Rs 103.9 crore.
powered by IRIS
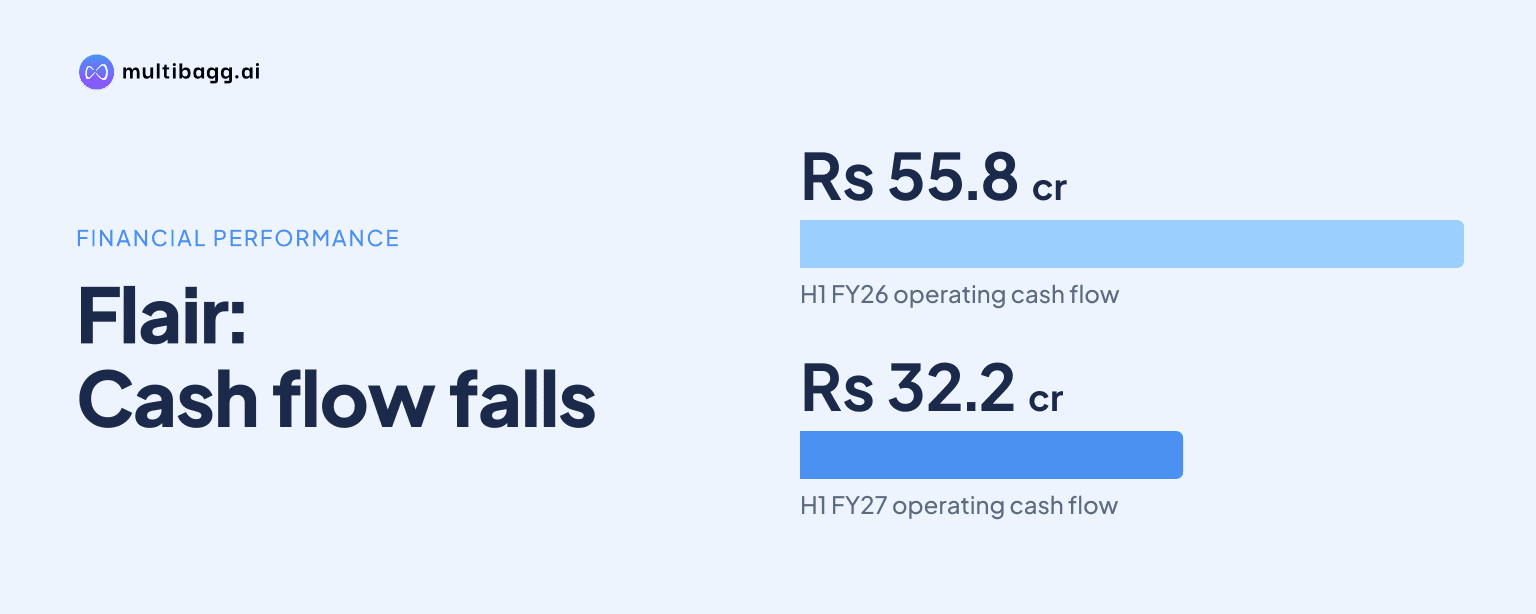
Flair® reported net cash from operating activities of Rs 32.2 crore in the first half (H1) of financial year (FY) 2027, down 42% from Rs 55.8 crore in H1 FY26, while inventory rose Rs 39.3 crore and trade receivables increased Rs 58.1 crore from March 2026 to September 2026. The reduction came despite H1 revenue increasing 8.2% to Rs 659.4 crore.
Know Flair Writing Industries inside out
Results, valuation, peers and who's buying, in one view.
Why did Flair’s operating cash flow decline in H1 FY27?
Flair’s net cash from operating activities declined by Rs 23.6 crore year on year to Rs 32.2 crore in the period ended September 2026, from Rs 55.8 crore in the period ended September 2025. Cash generated from operations before direct taxes was Rs 51.0 crore, down Rs 26.8 crore from Rs 77.8 crore a year earlier. Direct taxes paid were Rs 18.8 crore, compared with Rs 21.9 crore in H1 FY26.
The cash-flow statement does not provide a line-by-line reconciliation of working-capital movements, so it does not assign the decline to an individual balance-sheet item. However, the balance sheet records a Rs 97.4 crore increase in inventories and trade receivables combined between March 2026 and September 2026. That expansion coincided with an Rs 86.0 crore increase in total current assets, from Rs 799.4 crore to Rs 885.4 crore.
How much did Flair’s inventories and receivables increase?
Flair’s inventories increased Rs 39.3 crore to Rs 393.3 crore at September 2026 from Rs 354.0 crore at March 2026, while trade receivables increased Rs 58.1 crore to Rs 331.5 crore from Rs 273.4 crore. Receivables accounted for the larger part of the combined increase, rising about 21% over the six-month comparison, versus an approximately 11% rise in inventories.
Other current assets moved in the opposite direction, declining Rs 11.4 crore to Rs 160.6 crore at September 2026. Even after that reduction, total current assets were Rs 885.4 crore, compared with Rs 799.4 crore at March 2026. Inventories were the largest reported current-asset line at September 2026, followed by trade receivables.
The expansion in the two operating asset lines occurred alongside higher sales. Revenue from operations rose Rs 49.9 crore to Rs 659.4 crore in H1 FY27 from Rs 609.5 crore in H1 FY26. The presentation does not disclose collection days, inventory days, inventory composition, customer concentration or an ageing schedule, so it establishes the movement in balances but not the duration or composition of the underlying working capital.
How did Flair’s profit performance compare with cash generation?
Flair’s H1 FY27 profit for the period was Rs 60.8 crore, down Rs 10.9 crore, or 15.2%, from Rs 71.7 crore in H1 FY26, while net operating cash flow fell by Rs 23.6 crore. EBITDA, or earnings before interest, tax, depreciation and amortisation, declined Rs 6.0 crore to Rs 103.9 crore, and the EBITDA margin fell to 15.8% from 18.0%.
Revenue growth did not translate into higher reported profit or operating cash generation in the half year. Gross profit increased Rs 13.4 crore to Rs 324.2 crore, but gross margin declined to 49.2% from 51.0%. Cost of materials consumed rose Rs 36.4 crore to Rs 335.1 crore, while employee benefits expense increased Rs 8.3 crore to Rs 115.0 crore and other expenses increased Rs 11.1 crore to Rs 105.3 crore.
The second quarter (Q2) showed a different sequential revenue pattern but lower EBITDA. Q2 FY27 revenue was Rs 340.1 crore, 6.5% above Rs 319.2 crore in the first quarter (Q1) of FY27, while EBITDA was Rs 50.6 crore, 5.2% below Rs 53.3 crore in Q1. Q2 EBITDA margin was 14.9%, compared with 16.7% in Q1 and 18.8% in Q2 FY26.
Got a follow-up? Ask IRIS
What changed in Flair’s funding and balance sheet?
Flair’s total assets increased Rs 106.0 crore to Rs 1,475.8 crore at September 2026 from Rs 1,369.8 crore at March 2026. This matched a Rs 55.6 crore increase in total equity and a Rs 50.4 crore increase in total liabilities. Total equity was Rs 1,198.1 crore at September, compared with Rs 1,142.5 crore at March.
Current liabilities rose Rs 62.7 crore to Rs 215.8 crore over the six months. Trade payables increased Rs 34.5 crore to Rs 106.7 crore, and other current liabilities increased Rs 29.0 crore to Rs 81.5 crore. Current borrowings and lease liabilities increased Rs 5.4 crore to Rs 23.0 crore, while non-current borrowings and lease liabilities declined Rs 14.6 crore to Rs 34.1 crore.
Beyond working capital, property, plant and equipment rose Rs 25.2 crore to Rs 479.5 crore, while capital work-in-progress fell Rs 25.6 crore to Rs 34.4 crore. Cash flow from investing activities was an outflow of Rs 20.4 crore in H1 FY27, smaller than the Rs 55.5 crore outflow in H1 FY26. The presentation does not specify the projects, asset purchases or disposals behind that investing cash-flow movement.
What happened to Flair’s cash balance in H1 FY27?
Flair ended September 2026 with cash and cash equivalents of Rs 1.3 crore, down Rs 5.2 crore from Rs 6.5 crore at the beginning of the year. The closing cash balance was also Rs 35.5 crore below the Rs 36.8 crore reported at the end of September 2025, although the prior-year period began with Rs 56.6 crore of cash and cash equivalents.
The smaller year-on-year investing outflow and lower financing outflow meant the net cash decrease of Rs 5.2 crore in H1 FY27 was less than the Rs 19.8 crore decrease in H1 FY26. Financing activities used Rs 17.0 crore in H1 FY27, compared with Rs 20.2 crore a year earlier. These movements show that lower operating inflow was accompanied by reduced cash outflows elsewhere, but the presentation does not identify future funding needs.
Conclusion
Flair’s H1 FY27 figures show revenue rose 8.2% to Rs 659.4 crore while net cash from operating activities fell 42% to Rs 32.2 crore. Inventories and trade receivables together increased Rs 97.4 crore from March 2026, while EBITDA declined 5.5% to Rs 103.9 crore and profit for the period declined 15.2% to Rs 60.8 crore.
The presentation leaves the composition and ageing of Rs 393.3 crore of inventories and Rs 331.5 crore of trade receivables undisclosed, as well as the detailed working-capital reconciliation. It also lists pen launches including Noir-X, Trust, Cloud and Script, but gives no sales target, working-capital target or scheduled cash-flow milestone for those products.