










Fusion Finance marginal borrowing cost falls to 9.4% in Q2
Key highlights
- Fusion Finance’s marginal cost of borrowing fell to 9.4% in Q2 FY27 from 10.1% in Q1 FY27.
- Fusion Finance projected Rs 1,297 crore of closing cash and cash equivalents for January 2027 to March 2027.
- Private-sector banks accounted for 53% of Fusion Finance’s lender mix in Q2 FY27, up from 47% in Q1 FY27.
- Fusion Finance reported Rs 2,822 crore of sanctions in hand and average liability maturity of 25.1 months in H1 FY27.
powered by IRIS
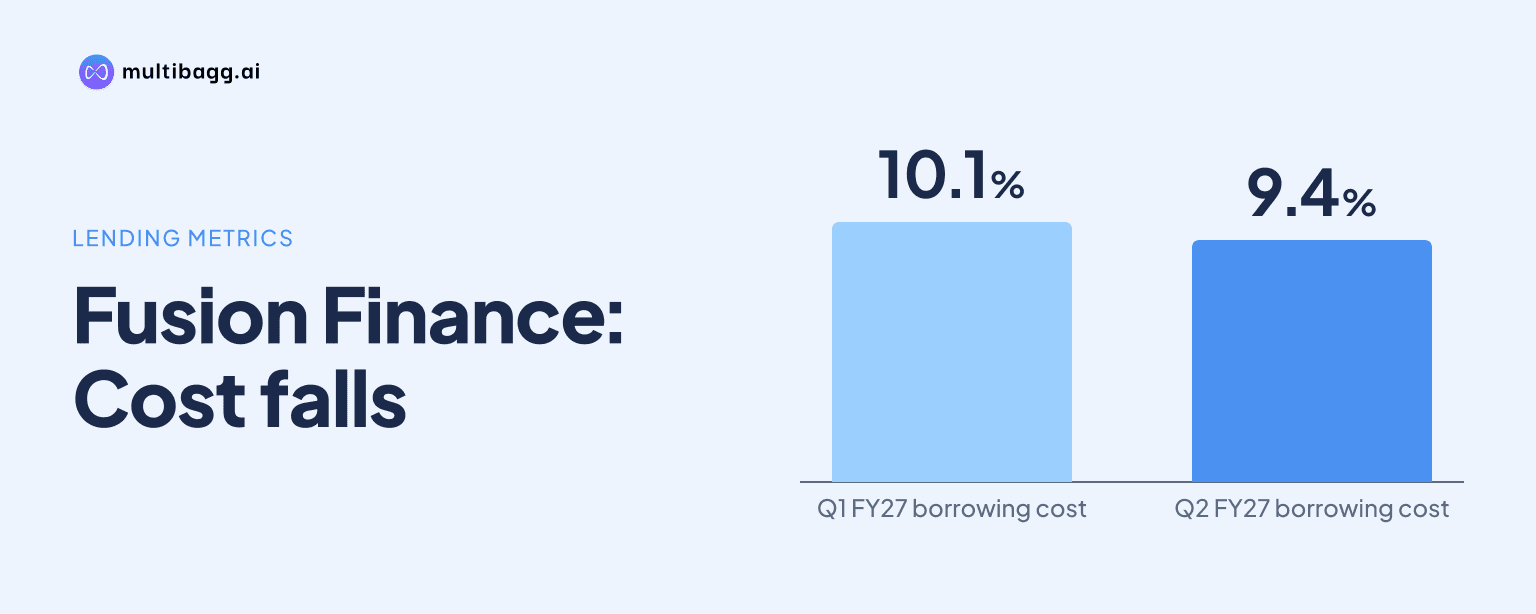
Fusion Finance Limited reduced its marginal cost of borrowing to 9.4% in Q2 FY27 from 10.1% in Q1 FY27, while projecting Rs 1,297 crore of closing cash and cash equivalents for January 2027 to March 2027. The liquidity schedule begins with Rs 1,661 crore of October 2026 opening cash and equivalents, including lien-free deposits.
Know Fusion Finance inside out
Results, valuation, peers and who's buying, in one view.
Why did Fusion Finance’s borrowing cost fall in Q2 FY27?
Fusion Finance’s marginal cost of borrowing fell by 0.7 percentage points quarter on quarter to 9.4% in Q2 FY27, while its overall cost of borrowing declined to 10.3% from 10.6% in Q1 FY27. The marginal measure had also decreased from 12.2% in Q2 FY26 to 11.2% in Q3 FY26, 10.3% in Q4 FY26 and 10.1% in Q1 FY27.
The latest marginal cost was 0.9 percentage points below the 10.3% overall borrowing cost in Q2 FY27. This reverses the position in Q2 FY26, when marginal cost of 12.2% was 1.9 percentage points above the 10.3% overall cost. For H1 FY27, Fusion Finance reported a 10.5% overall borrowing cost and a 9.8% marginal cost, compared with 10.3% and 11.2%, respectively, for FY26.
Fusion Finance reported finance cost of Rs 150.5 crore in Q2 FY27, compared with Rs 149.8 crore in Q1 FY27 and Rs 134.3 crore in Q2 FY26. Interest income on the portfolio rose to Rs 415.6 crore from Rs 386.1 crore sequentially, and net interest income increased 12% quarter on quarter to Rs 265.1 crore. The presentation does not assign finance-cost movements to individual lender groups or instruments.
How has Fusion Finance changed its lender and instrument mix?
Fusion Finance increased private-sector banks’ share of its lender mix to 53% in Q2 FY27 from 47% in Q1 FY27 and 36% in FY25. Foreign banks accounted for 21% in both Q2 and Q1 FY27, while non-banking financial institutions represented 11%, down from 13% in the preceding quarter.
Public-sector banks supplied 8% of the Q2 FY27 lender mix, compared with 11% in Q1 FY27, 16% in FY26 and 27% in FY25. Domestic development finance institutions accounted for 2%, down from 3% in Q1 FY27, while foreign development finance institutions increased to 3% from 2%. Foreign portfolio investors represented 2%, and all lender categories totalled 100%.
Fusion Finance’s term-loan share was 78% in Q2 FY27, below 81% in Q1 FY27, 82% in FY26 and 94% in FY25. Pass-through certificates (PTCs) increased to 10% from 6% in Q1 FY27 and 5% in FY26, having been 0% in FY25. External commercial borrowings accounted for 7%, non-convertible debentures (NCDs) for 4%, and subordinated debt for 1% in Q2 FY27.
Got a follow-up? Ask IRIS
What liquidity does Fusion Finance project through March 2027?
Fusion Finance projects Rs 1,297 crore of closing cash and cash equivalents for January 2027 to March 2027, following Rs 1,613 crore in October 2026, Rs 1,582 crore in November 2026 and Rs 1,400 crore in December 2026. The October opening cash balance of Rs 1,661 crore includes lien-free deposits.
The January to March 2027 projection assumes loan recovery equal to 90% of scheduled demand. It shows Rs 2,719 crore of total inflow, comprising Rs 1,400 crore of opening cash and Rs 1,319 crore of loan recoveries, against Rs 1,422 crore of total outflow.
The January to March outflow includes Rs 844 crore of borrowing principal and interest payments, Rs 398 crore of direct assignment, PTC and business-correspondent principal and interest payments, and Rs 180 crore of operating expenditure. Separately, Fusion Finance reported Rs 2,822 crore of sanctions in hand, a disclosed funding-availability measure distinct from projected cash balances.
Does Fusion Finance have a positive asset-liability maturity profile?
Fusion Finance reported average asset maturity of 17.9 months and average liability maturity of 25.1 months in H1 FY27, leaving liabilities 7.2 months longer on average. The company describes this arrangement as positive asset-liability management (ALM); in FY26, assets averaged 17.5 months and liabilities averaged 24.9 months.
The gap was 4.7 months in FY25, when average asset maturity was 14.5 months and liability maturity was 19.2 months. Fusion Finance’s loan-maturity profile comprised 89% in the one-to-three-year bucket, 6% in the three-to-five-year bucket and 5% beyond five years.
Fusion Finance listed an A-/Stable long-term debt rating from CRISIL, A/Stable NCD ratings from CARE and ICRA, and an A1 commercial-paper rating from CRISIL. Its PTC ratings included AA+(SO), AA-(SO) and A(SO) from CRISIL, alongside AA+(SO) from ICRA and AA+(SO) and A+(SO) from CARE.
Conclusion
Fusion Finance’s Q2 FY27 liability data combine a lower 9.4% marginal borrowing cost with a changing funding mix led by private-sector banks at 53% and term loans at 78%. Its liabilities averaged 25.1 months to maturity against 17.9 months for assets, while the company’s liquidity schedule retains projected closing cash above Rs 1,297 crore through March 2027.
The next disclosed milestone is the projected cash path from October 2026 through March 2027, including the Rs 1,297 crore closing balance for January to March. That forecast depends on recoveries reaching 90% of scheduled demand and on the stated Rs 1,422 crore of outflows, while Fusion Finance also has Rs 2,822 crore of sanctions in hand.