










Fusion Finance returns to profit as Q2 PBT reaches Rs 86.5 crore
Key highlights
- Fusion Finance reported Rs 86.5 crore PBT in Q2 FY27, versus a Rs 22.1 crore loss in Q2 FY26.
- Impairment of financial instruments fell 65% year on year to Rs 38.5 crore in Q2 FY27.
- PPOP rose 40% year on year to Rs 125 crore, while cost to income declined to 62.7%.
- GNPA declined to 1.60% and NNPA to 0.11% in Q2 FY27.
powered by IRIS
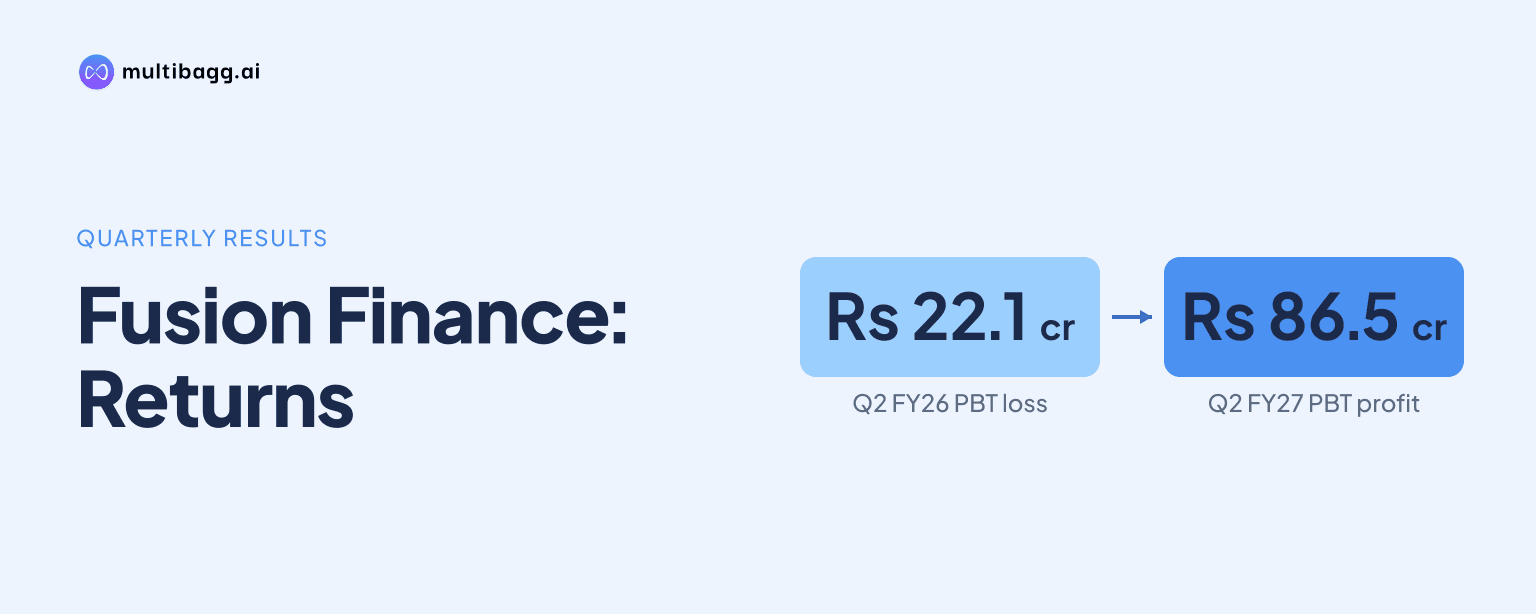
Fusion Finance Limited returned to profit in Q2 FY27, reporting profit before tax of Rs 86.5 crore against a Rs 22.1 crore loss a year earlier, as impairment of financial instruments fell 65% year on year to Rs 38.5 crore and pre-provision operating profit rose 40% to Rs 125 crore.
Know Fusion Finance inside out
Results, valuation, peers and who's buying, in one view.
How did Fusion Finance return to profit in Q2 FY27?
Fusion Finance returned to profit because its Rs 125 crore pre-provision operating profit, or PPOP, exceeded the Rs 38.5 crore impairment charge in Q2 FY27. That produced Rs 86.5 crore profit before tax, or PBT, compared with a Rs 22.1 crore loss before tax in Q2 FY26. Reported profit after tax was also Rs 86.5 crore in Q2 FY27, versus a Rs 22.1 crore loss in the prior-year quarter.
The quarter also improved sequentially. PBT rose 39% from Rs 62.4 crore in Q1 FY27, while PPOP increased 22% from Rs 102.1 crore. Impairment fell 3% quarter on quarter from Rs 39.7 crore, so the Rs 22.9 crore increase in operating profit was larger than the Rs 1.2 crore reduction in the impairment expense. Both higher earnings before provisions and lower charges contributed to the quarter's result.
What drove Fusion Finance's operating leverage in Q2 FY27?
Fusion Finance's operating leverage reflected income expanding faster than operating expenses in Q2 FY27. Gross income net of finance cost increased 12% year on year to Rs 335.2 crore, while total operating expenses were nearly unchanged at Rs 210.2 crore, compared with Rs 209.4 crore in Q2 FY26. Consequently, PPOP increased by Rs 36 crore from Rs 89 crore.
Net interest income rose 7% year on year to Rs 265.1 crore, supported by an 8% increase in interest income on the portfolio to Rs 415.6 crore. Finance cost rose 12% to Rs 150.5 crore, but other income lines also increased: treasury income reached Rs 21.2 crore, net gain on derecognition was Rs 16.4 crore and other operating income was Rs 32.5 crore. These three lines totalled Rs 70.1 crore, compared with Rs 34.2 crore a year earlier.
The ratio data records the operating-cost change. Cost to income declined to 62.7% in Q2 FY27 from 66.9% in Q1 FY27 and 70.2% in Q2 FY26. Operating expenditure to average assets under management, or AUM, was 10.7%, down from 10.9% in Q1 FY27 and 11.4% in Q2 FY26. Employee benefit expense increased only 2% year on year to Rs 157.7 crore, while other expenses declined 4% to Rs 50.7 crore.
Got a follow-up? Ask IRIS
How did Fusion Finance's credit indicators change?
Fusion Finance's reported credit indicators improved through Q2 FY27 alongside the lower impairment charge. Gross non-performing assets, or GNPA, fell to 1.60% from 2.51% in Q1 FY27 and 4.61% in Q2 FY26. Net non-performing assets, or NNPA, declined to 0.11%, compared with 0.47% in the preceding quarter and 0.38% one year earlier.
The quarterly impairment figure was Rs 38.5 crore in Q2 FY27, down Rs 72.7 crore from Rs 111.2 crore in Q2 FY26. For H1 FY27, impairment was Rs 78.2 crore, a 73% reduction from Rs 290 crore in H1 FY26. Over the same half-year comparison, PBT changed to a Rs 148.9 crore profit from a Rs 114.4 crore loss, while PPOP rose 29% to Rs 227.1 crore.
Capital to risk-weighted assets ratio, or CRAR, was 36.75% in Q2 FY27, compared with 36.95% in Q1 FY27 and 31.31% in Q2 FY26. The small quarter-on-quarter movement in CRAR occurred as net loans grew 6% to Rs 6,789.6 crore, while total equity rose 4% to Rs 2,613.9 crore. The reported Q2 FY27 CRAR was therefore 5.44 percentage points above the Q2 FY26 level.
What do Fusion Finance's balance sheet and funding figures show?
Fusion Finance's loans net of impairment loss allowance were Rs 6,789.6 crore at Q2 FY27, up 14% from Rs 5,936.2 crore a year earlier and 6% from Rs 6,405.9 crore in Q1 FY27. Total assets were Rs 8,857 crore, increasing 25% year on year, while borrowings other than debt securities rose 15% to Rs 5,615 crore. The loan-book expansion occurred alongside the earnings recovery rather than being its only reported driver.
Liquidity figures showed cash and other bank balances of Rs 1,660.7 crore at Q2 FY27, despite a 12% sequential decrease from Rs 1,880.2 crore. The presentation's projected liquidity schedule shows closing cash and equivalents of Rs 1,613 crore in October 2026, Rs 1,582 crore in November 2026, Rs 1,400 crore in December 2026 and Rs 1,297 crore for January to March 2027. The projections assume loan recovery at 90% of scheduled demand.
Funding costs were stable on an average basis but lower for new borrowing. The average cost of borrowing was 10.3% in Q2 FY27, compared with 10.6% in Q1 FY27, while marginal cost of borrowing declined to 9.4% from 10.1%. Portfolio yield increased to 22.8% from 22.5%, lifting net interest margin, or NIM, and spread to 12.5% from 11.9% quarter on quarter.
Conclusion
Fusion Finance's Q2 FY27 figures show that the earnings change was supported by both operating income and credit-cost movements. Gross income net of finance cost rose Rs 36.8 crore year on year to Rs 335.2 crore, total operating expenses rose only Rs 0.8 crore to Rs 210.2 crore, and impairment declined Rs 72.7 crore to Rs 38.5 crore. The cost-to-income ratio consequently fell to 62.7% from 70.2% a year earlier.
The next disclosed items to watch are the projected cash-and-equivalent balances through January to March 2027 and the execution of Rs 2,822 crore of sanctions in hand. The presentation also provides quarterly measures to track as the loan book and borrowings develop, including the Q2 FY27 GNPA of 1.60%, NNPA of 0.11%, NIM and spread of 12.5%, and CRAR of 36.75%.