










Ganesh H1 FY27 EBITDA margin reaches 12.2% as returns rise
Key highlights
- Ganesh reported a 12.2% EBITDA margin in H1 FY27, up from 9.8% in FY26.
- Ganesh reported H1 FY27 PAT of Rs 31.3 crore and a PAT margin of 7.5%.
- Ganesh’s annualised ROCE reached 21.9% in H1 FY27, compared with 17.9% in FY26.
- Ganesh reported H1 FY27 net debt-to-EBITDA of negative 0.5 times and net cash from operating activities of Rs 11.9 crore.
powered by IRIS
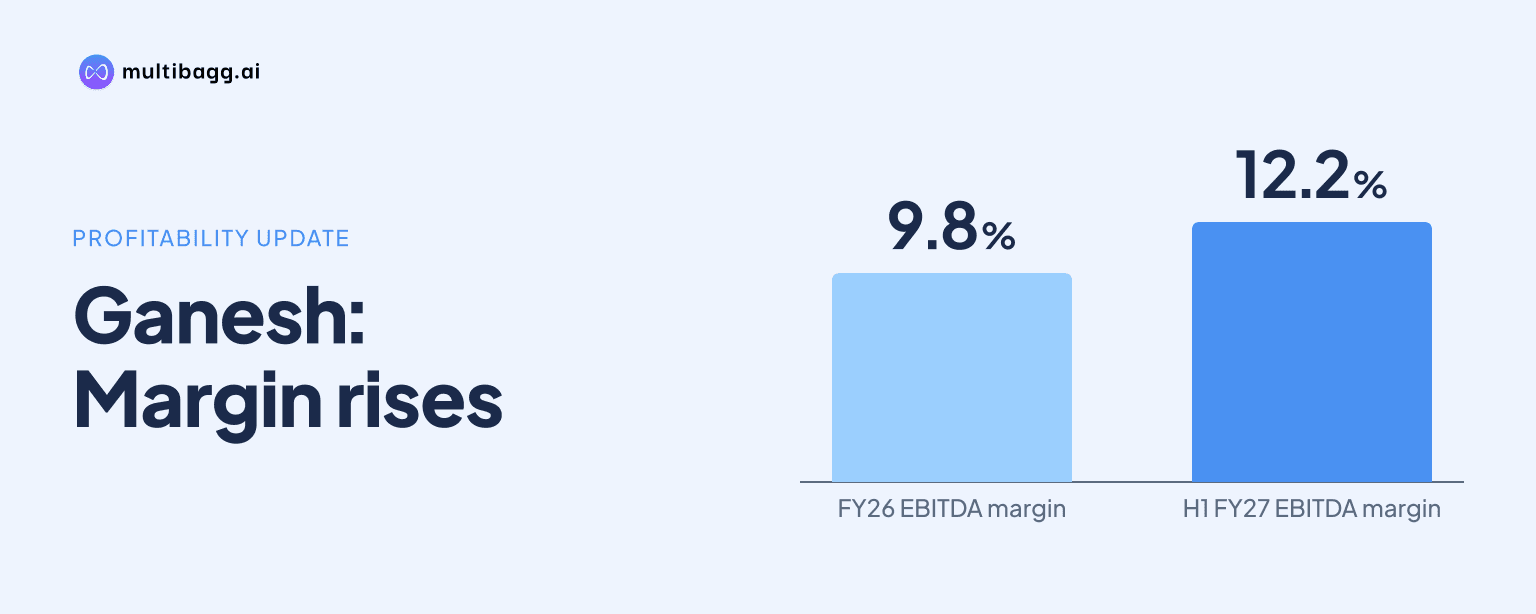
Ganesh reported a 12.2% EBITDA margin in H1 FY27, compared with 9.8% in FY26, as EBITDA was Rs 50.6 crore on revenue from operations of Rs 415.3 crore. Annualised return on capital employed reached 21.9%, while net debt-to-EBITDA was negative 0.5 times and profit after tax was Rs 31.3 crore.
Know Ganesh Consumer Products inside out
Results, valuation, peers and who's buying, in one view.
What changed in Ganesh’s H1 FY27 profitability?
Ganesh’s profitability improved in H1 FY27, with EBITDA margin rising 2.4 percentage points to 12.2% from 9.8% in FY26 and profit after tax, or PAT, margin rising to 7.5% from 4.8%. H1 FY27 EBITDA was Rs 50.6 crore and PAT was Rs 31.3 crore, compared with FY26 EBITDA of Rs 85.6 crore and PAT of Rs 42.4 crore for the full year.
The H1 FY27 EBITDA margin also exceeded the 9.2% reported in FY23, 8.3% in FY24 and 8.6% in FY25. Ganesh defines EBITDA as profit before exceptional item and tax, plus finance cost and depreciation and amortisation, less other income; EBITDA rose from Rs 56.1 crore in FY23 to Rs 85.6 crore in FY26.
How did Ganesh’s revenue and profit develop across the reported periods?
Ganesh’s revenue from operations increased from Rs 610.8 crore in FY23 to Rs 871.4 crore in FY26, while PAT rose from Rs 27.1 crore to Rs 42.4 crore. Revenue growth slowed in FY26, when revenue increased by Rs 20.9 crore from FY25, compared with the Rs 91.4 crore increase between FY24 and FY25.
Ganesh reported Rs 415.3 crore of revenue, Rs 50.6 crore of EBITDA and Rs 31.3 crore of PAT for H1 FY27. The presentation does not provide H1 FY26 revenue, EBITDA or PAT, so it does not support a year-on-year comparison for the first half.
Ganesh’s business-to-consumer, or B2C, product mix changed in H1 FY27, although the presentation does not allocate revenue or profit by category. Value-added products represented 60% of B2C revenue, up from 56% in FY26, emerging products rose to 10% from 9%, and atta declined to 30% from 35%; value-added products include maida, sooji, sattu, besan and dalia.
Got a follow-up? Ask IRIS
What does Ganesh’s negative net debt ratio show?
Ganesh reported negative net debt ratios in FY26 and H1 FY27, which indicate a net cash position under the reported measures. Net debt-to-EBITDA moved from 0.7 times in FY25 to negative 0.8 times in FY26 and negative 0.5 times in H1 FY27, with the H1 ratio annualised.
Ganesh’s net debt-to-equity ratio was negative 0.2 times in FY26 and negative 0.1 times in H1 FY27, compared with 0.4 times in FY23. Net debt-to-EBITDA was 1.5 times in FY23, 0.6 times in FY24 and 0.7 times in FY25, showing the shift from positive net debt in those years to negative ratios in FY26 and H1 FY27.
Ganesh’s net cash from operating activities did not move in a straight line, falling to Rs 11.9 crore in H1 FY27 from Rs 80.5 crore in FY26. Net cash from operating activities was negative Rs 13.1 crore in FY23, Rs 88.5 crore in FY24 and Rs 46.1 crore in FY25, while its ratio to EBITDA was 0.2 times in H1 FY27 versus 0.9 times in FY26.
How are Ganesh’s returns and shareholder payouts changing?
Ganesh reported annualised return on equity, or ROE, of 16.4% and annualised return on capital employed, or ROCE, of 21.9% in H1 FY27, compared with 14.2% and 17.9% in FY26. The H1 FY27 return measures are annualised and therefore are not directly equivalent to completed full-year ratios.
Ganesh’s ROCE was 15.0% in FY23, 16.7% in FY24 and 19.8% in FY25 before reaching 21.9% on an annualised basis in H1 FY27. The presentation defines capital employed as total equity plus total debt, less capital reserve and capital redemption reserve.
Ganesh reported a 47.8% dividend payout ratio in H1 FY27, calculated using an interim dividend of Rs 3.70 per share, compared with 47.7% in FY26. The ratio was 84.7% in FY25 and 18.5% in both FY23 and FY24; the company also reported a 32-day cash conversion cycle and said 100% of general-trade sales are on an advance basis, except spices with 15 to 30 days of credit.
Conclusion
Ganesh’s H1 FY27 figures show higher EBITDA and PAT margins, as well as higher annualised return measures, than FY26, alongside negative net debt ratios. Revenue increased from Rs 610.8 crore in FY23 to Rs 871.4 crore in FY26, but the FY26 revenue increase of Rs 20.9 crore was lower than the Rs 91.4 crore increase recorded in FY25.
The next disclosed developments to watch are Ganesh’s planned broader commercial rollout of ethnic snacks during Q3 FY27 and the planned packaged-sweets launch using the existing Amta manufacturing unit. The presentation also leaves operating cash conversion as a point to monitor after H1 FY27 net cash from operating activities of Rs 11.9 crore and a 0.2-times NCOA-to-EBITDA ratio.