










Greenlam net debt drops to ₹921.8 crore as working capital rises
Key highlights
- Greenlam's H1FY27 net debt was ₹921.8 crore, down ₹18.3 crore from ₹940.1 crore in FY26.
- Q2FY27 net working capital rose to ₹504 crore and 53 days from ₹413 crore and 47 days in Q2FY26.
- Q2FY27 inventory increased by ₹90 crore year on year to ₹801 crore, while trade receivables rose by ₹30 crore to ₹242 crore.
- H1FY27 total debt was ₹1,001.1 crore, comprising ₹787 crore of long-term debt and ₹214.1 crore of short-term debt.
powered by IRIS
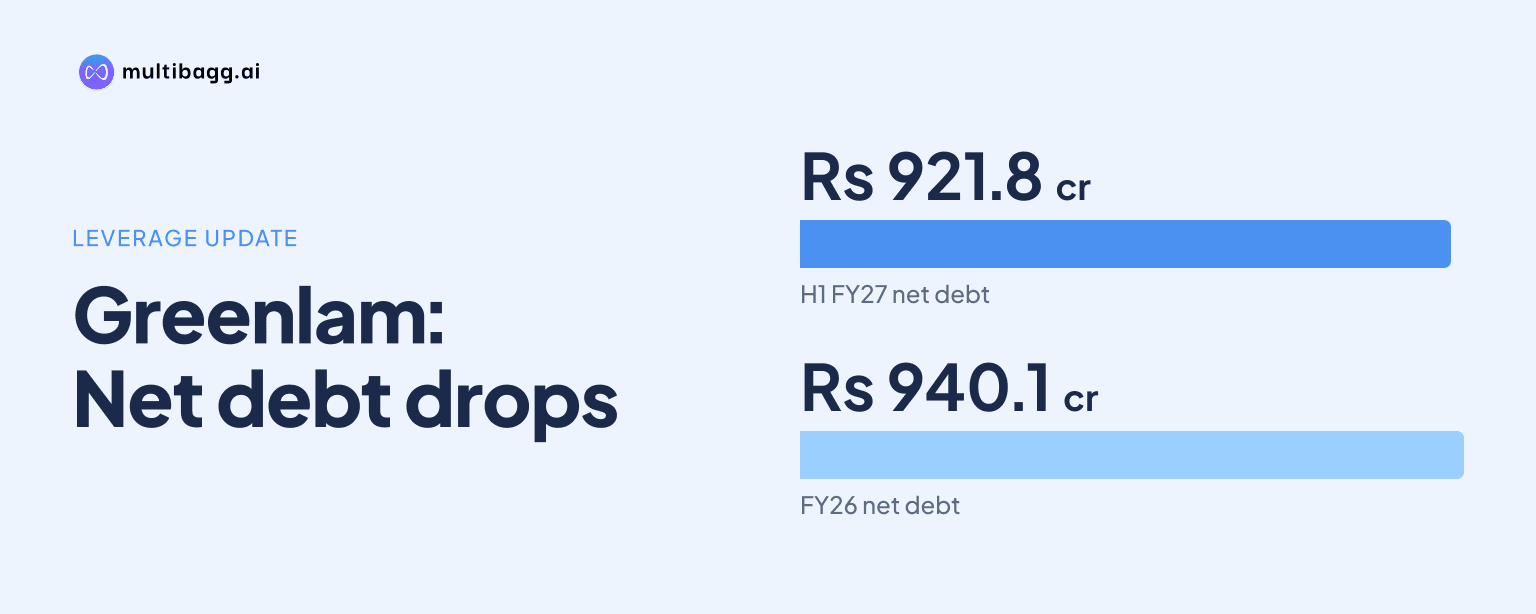
Greenlam Industries Limited reduced net debt to ₹921.8 crore in H1FY27 from ₹940.1 crore in FY26, but net working capital increased to ₹504 crore and 53 days in Q2FY27 from ₹413 crore and 47 days a year earlier. The change combined lower total debt with higher inventory and trade receivables.
Know Greenlam Industries inside out
Results, valuation, peers and who's buying, in one view.
How did Greenlam's debt position change in H1FY27?
Greenlam's net debt declined by ₹18.3 crore to ₹921.8 crore in H1FY27, as total debt fell by ₹54.3 crore to ₹1,001.1 crore from ₹1,055.4 crore in FY26. This was partly offset by a ₹36 crore reduction in cash and liquid investments, which stood at ₹79.3 crore in H1FY27 versus ₹115.3 crore in FY26.
The reduction in total debt came from long-term borrowings. Long-term debt, including its current portion, decreased by ₹96.9 crore to ₹787 crore, while short-term debt increased by ₹42.6 crore to ₹214.1 crore. The presentation specifies that total debt is before an Indian Accounting Standards, or IndAS, adjustment of ₹8.75 crore for H1FY27 and ₹9.92 crore for FY26.
The debt figures show that Greenlam lowered gross borrowings by more than net debt because its cash balance also declined. Cash and liquid investments were ₹79.3 crore against total debt of ₹1,001.1 crore in H1FY27, compared with ₹115.3 crore against ₹1,055.4 crore at FY26. The presentation does not state the uses of cash or the reasons for the change in the debt mix.
Why did Greenlam's net working-capital days increase?
Greenlam's net working capital rose by ₹91 crore to ₹504 crore in Q2FY27, while net working-capital days increased by six days to 53 from 47 in Q2FY26. Inventory increased by ₹90 crore to ₹801 crore and trade receivables rose by ₹30 crore to ₹242 crore, exceeding the ₹27 crore increase in trade payables to ₹538 crore.
Inventory was the largest component of working capital at ₹801 crore in Q2FY27, equal to 84 days, compared with ₹711 crore and 80 days in Q2FY26. Trade receivables increased to 25 days from 24 days. In contrast, trade payables increased in amount but declined to 56 days from 58 days, reducing the offset against inventory and receivables.
The Q2FY27 position improved in days from Q1FY27 even as the amount increased. Net working capital was ₹494 crore and 56 days in Q1FY27, versus ₹504 crore and 53 days in Q2FY27. Inventory fell by ₹6 crore and eight days from ₹807 crore and 92 days, while receivables increased by ₹29 crore and payables by ₹11 crore over the quarter.
Got a follow-up? Ask IRIS
What does the H1FY27 working-capital comparison show?
Greenlam reported H1FY27 net working capital of ₹504 crore and 55 days, compared with ₹413 crore and 51 days in H1FY26. The ₹91 crore increase matched the Q2FY27 year-on-year increase in amount, while the H1 days measure showed a four-day increase rather than the six-day Q2 increase.
At the H1 level, inventory was ₹801 crore and 87 days in H1FY27, compared with ₹711 crore and 88 days in H1FY26. Inventory value therefore increased by ₹90 crore even as inventory days declined by one day. Trade receivables increased to ₹242 crore and 26 days from ₹212 crore and 26 days, leaving the days measure unchanged.
Trade payables were ₹538 crore and 58 days in H1FY27, compared with ₹511 crore and 63 days in H1FY26. Greenlam therefore had ₹27 crore more in payables but five fewer payable days. The presentation provides the operating metrics but does not disclose the underlying credit terms, collection policy or inventory categories behind these changes.
How do debt and working capital relate to Greenlam's capital base?
Greenlam reported capital employed of ₹2,210.9 crore in H1FY27, down ₹19.7 crore from ₹2,230.6 crore in FY26, while net worth increased by ₹36.7 crore to ₹1,215.8 crore from ₹1,179.1 crore. Against that capital base, net debt of ₹921.8 crore was ₹18.3 crore lower than the FY26 balance, whereas net working capital was ₹91 crore higher than the Q2FY26 position.
Earnings and return measures were higher year on year in H1FY27. Earnings before interest and tax, or EBIT, before exceptional items rose to ₹106.3 crore from ₹81.5 crore in H1FY26, and profit after tax increased to ₹45.7 crore from ₹16.1 crore. Return on capital employed, or ROCE, was 9.6% versus 7.4%, while return on equity, or ROE, was 7.5% versus 2.8%.
The Panel and Allied segment had capital employed of ₹768.8 crore in Q2FY27, down from ₹781.9 crore in Q2FY26. Its net revenue rose to ₹107 crore from ₹47.8 crore, and earnings before interest, tax, depreciation and amortisation, or EBITDA, excluding foreign-exchange impact, was ₹8.7 crore versus a loss of ₹7.3 crore. These segment results provide operating context, but the presentation does not allocate group working-capital or debt balances by segment.
Conclusion
Greenlam's H1FY27 balance-sheet update shows two simultaneous movements: net debt decreased by ₹18.3 crore as total borrowings declined, while cash fell by ₹36 crore. At the same time, Q2FY27 net working capital increased by ₹91 crore year on year, driven principally by a ₹90 crore rise in inventory and a ₹30 crore rise in receivables.
The next reported comparisons to watch are whether inventory days, which fell to 84 in Q2FY27 from 92 in Q1FY27, remain below the Q1FY27 level, and whether receivable and payable days change from 25 and 56, respectively. The presentation identifies IndAS debt adjustments of ₹8.75 crore in H1FY27 and ₹9.92 crore in FY26, but does not disclose a debt-reduction or working-capital target.