










Greenlam Industries Limited Panel & Allied EBITDA Turns Positive
Key highlights
- Greenlam’s Panel & Allied revenue rose 123.9% year on year to Rs 107.0 crore in Q2FY27.
- Panel & Allied EBITDA before forex turned positive at Rs 8.7 crore in Q2FY27 from negative Rs 7.3 crore in Q2FY26.
- Greenlam chipboard utilisation reached 61% in Q2FY27, up from 36% a year earlier.
- Chipboard sales rose 78.3% to 46,871 CBM in Q2FY27, while average realisation increased 24.2% to Rs 22,591 per CBM.
powered by IRIS
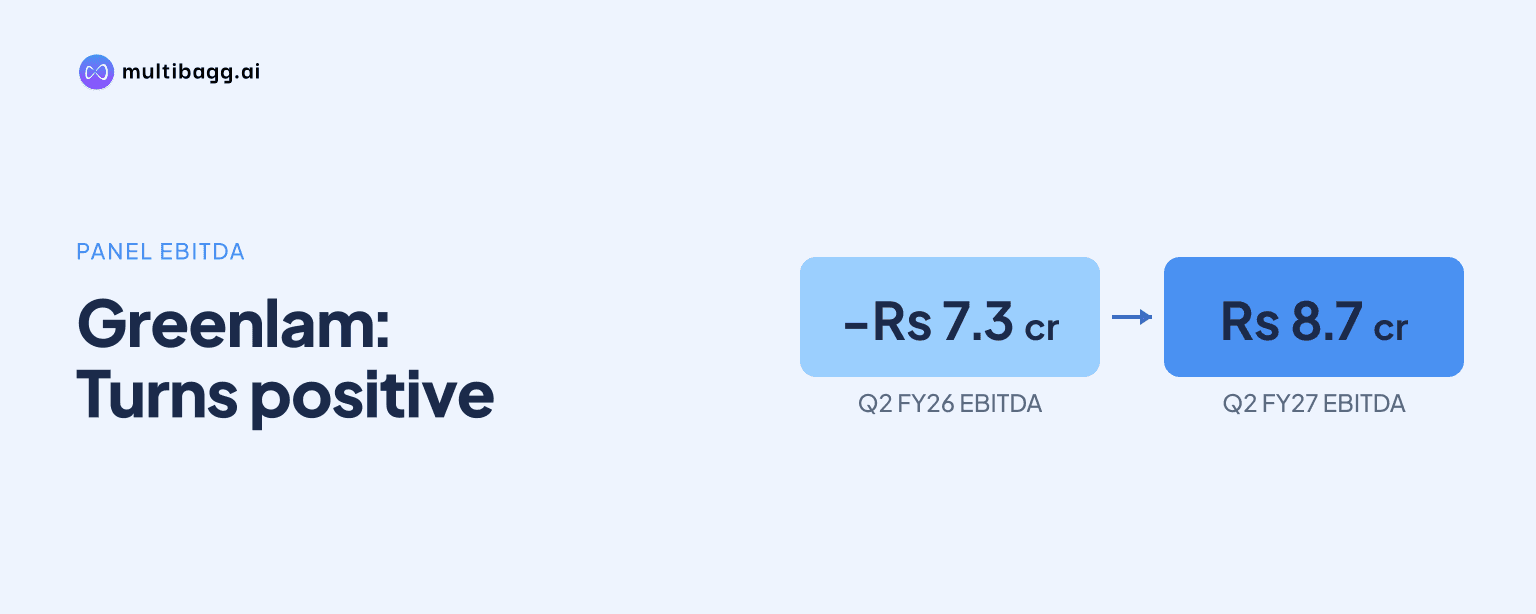
Greenlam Industries Limited’s Panel & Allied segment reported pre-forex EBITDA of Rs 8.7 crore in Q2FY27, reversing a Rs 7.3 crore loss in Q2FY26, as revenue rose 123.9% to Rs 107.0 crore and chipboard capacity utilisation reached 61% from 36%. The segment includes plain and pre-laminated chipboards.
Know Greenlam Industries inside out
Results, valuation, peers and who's buying, in one view.
What drove Greenlam’s Panel & Allied turnaround in Q2FY27?
Greenlam’s Panel & Allied turnaround was marked by a swing to Rs 8.7 crore of earnings before interest, tax, depreciation and amortisation, or EBITDA, before foreign-exchange impact in Q2FY27, from negative Rs 7.3 crore a year earlier. Revenue increased to Rs 107.0 crore from Rs 47.8 crore, while gross margin increased to Rs 47.6 crore from Rs 16.7 crore. EBITDA including foreign-exchange impact was also positive at Rs 6.8 crore, compared with negative Rs 14.1 crore in Q2FY26.
The reported margin changes show how the segment’s financial profile changed over the year. Gross margin was 44.5% in Q2FY27, up 950 basis points from 35.0% in Q2FY26; one basis point is one-hundredth of a percentage point. Pre-forex EBITDA margin moved to 8.1% from negative 15.3%, while the margin including forex moved to 6.3% from negative 29.4%. These figures are reported for the Panel & Allied segment rather than for chipboard as a separately disclosed profit line.
How did Greenlam’s chipboard volumes and utilisation change?
Greenlam’s chipboard production rose 66.5% year on year to 44,241 cubic metres, or CBM, in Q2FY27, and capacity utilisation reached 61%, compared with 36% in Q2FY26. Installed annual capacity was unchanged at 292,380 CBM in both quarters. Production was broadly stable against Q1FY27, declining 1.3% from 44,838 CBM, while utilisation remained 61% sequentially.
Sales expanded faster than production on a year-on-year basis. Greenlam sold 46,871 CBM of chipboard in Q2FY27, up 78.3% from 26,287 CBM in Q2FY26 and 13.2% from 41,418 CBM in Q1FY27. The sales figure exceeded quarterly production by 2,630 CBM in Q2FY27, whereas sales were 284 CBM below production in Q2FY26. The presentation does not specify the inventory or channel factors behind that difference.
Realisation also increased from the prior year. Greenlam reported an average chipboard realisation of Rs 22,591 per CBM in Q2FY27, 24.2% above Rs 18,187 per CBM in Q2FY26. It was 0.8% below the Rs 22,764 per CBM reported in Q1FY27. Thus, the year-on-year increase in panel revenue coincided with higher chipboard sales volume, higher realisation and a 25-percentage-point increase in utilisation, while the sequential revenue gain occurred despite a small decline in reported realisation.
Got a follow-up? Ask IRIS
What does the first-half comparison show for Greenlam’s panel business?
Greenlam’s Panel & Allied segment reported Rs 201.6 crore of revenue and Rs 12.1 crore of pre-forex EBITDA in H1FY27, compared with Rs 78.8 crore of revenue and negative Rs 17.1 crore of EBITDA in H1FY26. The revenue increase was 155.9%, while gross margin rose 189.6% to Rs 88.7 crore. Pre-forex EBITDA margin consequently changed to 6.0% from negative 21.6%.
Chipboard operating data show a similar first-half expansion. Production increased 85.1% to 89,079 CBM in H1FY27 from 48,118 CBM in H1FY26, and sales increased 115.9% to 88,289 CBM from 40,896 CBM. Capacity utilisation was 61%, compared with 33%, while average realisation rose 17.6% to Rs 22,673 per CBM. The 28-percentage-point utilisation change occurred while annual installed capacity stayed fixed at 292,380 CBM across both periods.
Foreign-exchange effects had a different first-half result than in the comparable quarter. EBITDA including forex was Rs 12.1 crore in H1FY27, equal to the pre-forex figure, versus negative Rs 40.0 crore in H1FY26. The reported H1FY27 EBITDA margin including forex was 6.0%, against negative 50.7% a year earlier. In Q2FY27 alone, the difference between EBITDA before and after forex was Rs 1.9 crore, showing forex remained a separate reported factor in the quarterly result.
How does Greenlam’s panel performance compare with its other businesses?
Greenlam’s Panel & Allied segment grew faster than the Plywood & Allied segment in Q2FY27, although the two segments had different earnings outcomes. Panel revenue increased 123.9% year on year to Rs 107.0 crore, while Plywood & Allied revenue rose 7.5% to Rs 110.2 crore. Panel EBITDA before forex was Rs 8.7 crore, whereas Plywood & Allied recorded negative Rs 1.4 crore, improved from negative Rs 3.9 crore in Q2FY26.
The underlying volume data also differed. Plywood production rose 28.6% to 2.15 million square metres in Q2FY27, with utilisation rising to 46% from 35%. Its sales rose 22.8% to 1.94 million square metres and average realisation increased 4.2% to Rs 257 per square metre. Chipboard’s 78.3% sales growth and 24.2% realisation increase were larger percentage movements, but the products use different physical units and the presentation does not provide a common profitability measure by product.
Capital employed in Panel & Allied was Rs 768.8 crore at Q2FY27, down from Rs 781.9 crore at Q2FY26 and up from Rs 764.1 crore at Q1FY27. At the company level, Greenlam reported net working capital of Rs 504 crore, or 53 days, in Q2FY27, compared with Rs 413 crore and 47 days in Q2FY26. These company-wide working-capital figures are not allocated by segment, so they cannot establish the funding or cash conversion of the panel business on a standalone basis.
Conclusion
Greenlam’s disclosed Q2FY27 data show a Panel & Allied earnings reversal: revenue more than doubled, gross margin reached Rs 47.6 crore and EBITDA before forex became positive at Rs 8.7 crore. Chipboard’s 61% utilisation, 46,871 CBM of sales and Rs 22,591 per-CBM average realisation accompanied that segment-level shift, but profitability is not separately reported for chipboard alone.
The next reported measures to watch are whether chipboard utilisation remains near 61%, whether sales sustain their higher run rate, and how forex affects reported EBITDA. Greenlam’s annual chipboard capacity remained 292,380 CBM in Q2FY27 and H1FY27, while the presentation discloses no further volume target or capacity-expansion schedule.