










GreenLeaf H1 revenue rose 35.8%, while PAT gained 5.5% YoY
Key highlights
- GreenLeaf’s H1 FY27 revenue from operations rose 35.8% to Rs 28.6197 crore.
- H1 FY27 PAT increased 5.5% to Rs 3.0394 crore while total expenses rose 42.6% to Rs 24.6212 crore.
- Cost of material consumed increased 69.9% to Rs 25.2692 crore in H1 FY27.
- Basic EPS declined 17.8% to Rs 5.13 in H1 FY27.
powered by IRIS
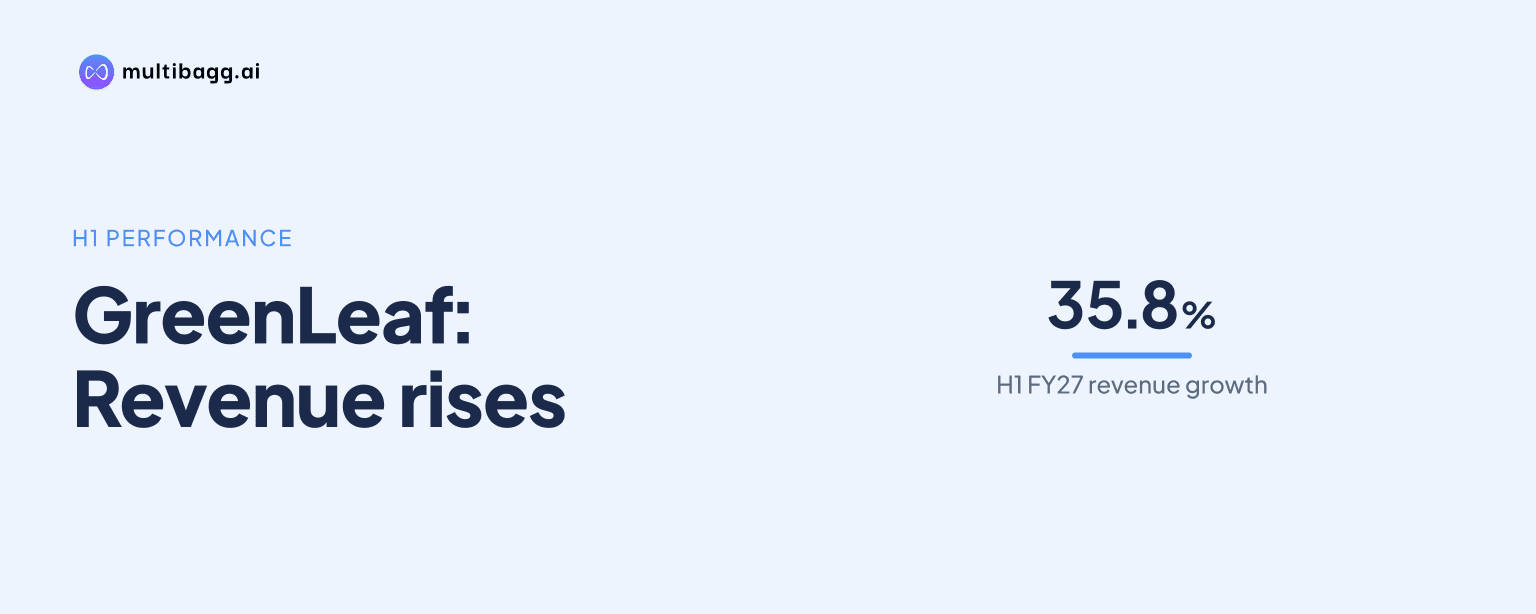
GreenLeaf Envirotech Ltd. reported H1 FY27 revenue from operations of Rs 28.6197 crore, up 35.8% year on year, while profit after tax rose 5.5% to Rs 3.0394 crore because total expenses increased 42.6%, faster than total income growth of 35.9%.
Know Greenleaf Envirotech inside out
Results, valuation, peers and who's buying, in one view.
What did GreenLeaf report in H1 FY27?
GreenLeaf reported revenue from operations of Rs 28.6197 crore in H1 FY27, compared with Rs 21.0776 crore in H1 FY26. Other income rose to Rs 8.92 lakh from Rs 4.63 lakh, taking total income to Rs 28.7088 crore from Rs 21.1239 crore. The revenue increase was Rs 7.5421 crore, while total income rose by Rs 7.5849 crore.
The presentation’s financial highlights show earnings before interest, tax, depreciation and amortisation, or EBITDA, of Rs 4.74 crore in H1 FY27, up 14% from Rs 4.16 crore in H1 FY26. GreenLeaf defines EBITDA as profit before tax, or PBT, plus finance costs and depreciation, including other income. The income statement reports PBT of Rs 4.0877 crore, up 6.1% from Rs 3.8538 crore, and PAT of Rs 3.0394 crore against Rs 2.8820 crore.
Why did GreenLeaf’s PAT lag revenue growth in H1 FY27?
GreenLeaf’s PAT lagged revenue growth because total expenses rose 42.6% to Rs 24.6212 crore, exceeding the 35.9% increase in total income. The resulting PBT increase was Rs 23.39 lakh, substantially below the Rs 7.5849 crore increase in total income. The presentation reported no exceptional or extraordinary items in either H1 FY27 or H1 FY26.
Cost of material consumed increased 69.9% to Rs 25.2692 crore from Rs 14.8739 crore. Employee benefit expenses rose 50.1% to Rs 3.2795 crore from Rs 2.1843 crore. The statement also recorded a negative change in inventories of Rs 6.5775 crore, compared with a negative Rs 93.19 lakh in H1 FY26, which reduced the effect of the higher material-consumption charge within total expenses.
Other expense lines also increased faster than revenue. Other expenses rose 139.2% to Rs 2.0015 crore, depreciation and amortisation increased 310.4% to Rs 33.41 lakh, and finance costs rose 39.4% to Rs 31.44 lakh. Current tax rose 11.4% to Rs 1.0903 crore, while deferred tax was a credit of Rs 4.21 lakh, compared with a credit of Rs 66,000 a year earlier.
Got a follow-up? Ask IRIS
How did GreenLeaf’s margins and per-share earnings change?
GreenLeaf’s reported figures imply a PAT margin of about 10.6% of revenue from operations in H1 FY27, down from about 13.7% in H1 FY26. PBT margin similarly moved to about 14.3% from about 18.3%. These calculations use reported PAT of Rs 3.0394 crore and revenue of Rs 28.6197 crore, rather than a margin figure stated by management.
The presentation’s reported EBITDA figures imply EBITDA of about 16.6% of revenue in H1 FY27, compared with about 19.7% in H1 FY26. This calculation uses EBITDA of Rs 4.74 crore and revenue of Rs 28.62 crore for H1 FY27, against Rs 4.16 crore and Rs 21.08 crore a year earlier. The presentation does not disclose an EBITDA-margin target.
Basic earnings per share, or EPS, fell 17.8% to Rs 5.13 from Rs 6.24. Paid-up share capital was Rs 5.9293 crore in H1 FY27, compared with Rs 4.6193 crore in H1 FY26, an increase of 28.4%. PAT therefore increased by 5.5%, while the presentation reported a lower amount of earnings per basic share.
How do GreenLeaf’s balance sheet and cash flow compare with FY26?
GreenLeaf’s total assets were Rs 71.7002 crore at H1 FY2027, compared with Rs 60.3845 crore at FY2026. Non-current assets rose to Rs 29.8304 crore from Rs 11.4192 crore, including capital work-in-progress of Rs 13.1627 crore versus Rs 3.4441 crore and other non-current assets of Rs 14.1570 crore versus Rs 5.7748 crore.
Current assets declined to Rs 41.8697 crore from Rs 48.9654 crore. Trade receivables fell to Rs 26.0494 crore from Rs 38.8164 crore, while inventories increased to Rs 9.5260 crore from Rs 2.9485 crore. Cash and cash equivalents declined to Rs 88.05 lakh from Rs 3.60 crore over the same balance-sheet comparison.
Net cash used in operating activities was Rs 5.0747 crore in H1 FY27, compared with Rs 5.9252 crore used in H1 FY26. A Rs 12.7670 crore reduction in trade receivables supported working capital, but inventory used Rs 6.5775 crore and other non-current assets used Rs 8.3821 crore. Long-term borrowings rose to Rs 7.7169 crore at H1 FY2027 from Rs 2.5476 crore at FY2026.
The annual series provides a wider comparison, although it is not directly comparable with a half-year period. Revenue rose from Rs 27.05 crore in FY23 to Rs 60.61 crore in FY26, while PAT rose from Rs 1.02 crore to Rs 7.23 crore. Return on equity, or ROE, was 20.73% in FY26 versus 36.34% in FY25, and return on capital employed, or ROCE, was 34.47% versus 46.45%.
Conclusion
GreenLeaf’s H1 FY27 result shows that the 35.8% rise in revenue did not translate proportionately into profit growth. Total expenses increased 42.6%, led by a 69.9% rise in material consumption, while PAT increased 5.5% and basic EPS declined 17.8%. The reported figures also imply lower PBT, EBITDA and PAT margins than in H1 FY26.
The next result will clarify whether GreenLeaf can convert its higher revenue base into greater profit growth while managing the balance-sheet movements disclosed at H1 FY2027. Matters left open by the presentation include the build-up in Rs 13.1627 crore of capital work-in-progress, the rise in inventories to Rs 9.5260 crore, and operating cash use of Rs 5.0747 crore.