










H & R Johnson doubles H1 EBITDA as tile prices offset volume
Key highlights
- HRJ’s H1 FY27 EBITDA rose 109.8% year on year to Rs 126.4 crore.
- HRJ’s H1 FY27 EBITDA margin expanded to 10.4% from 5.3%.
- HRJ’s tile realisations increased 17.1% to Rs 395 per square metre while volume fell 8.8% to 25.0 million square metres.
- HRJ’s GVT share reached 47% of tile sales volume in H1 FY27, versus 42% in FY26.
powered by IRIS
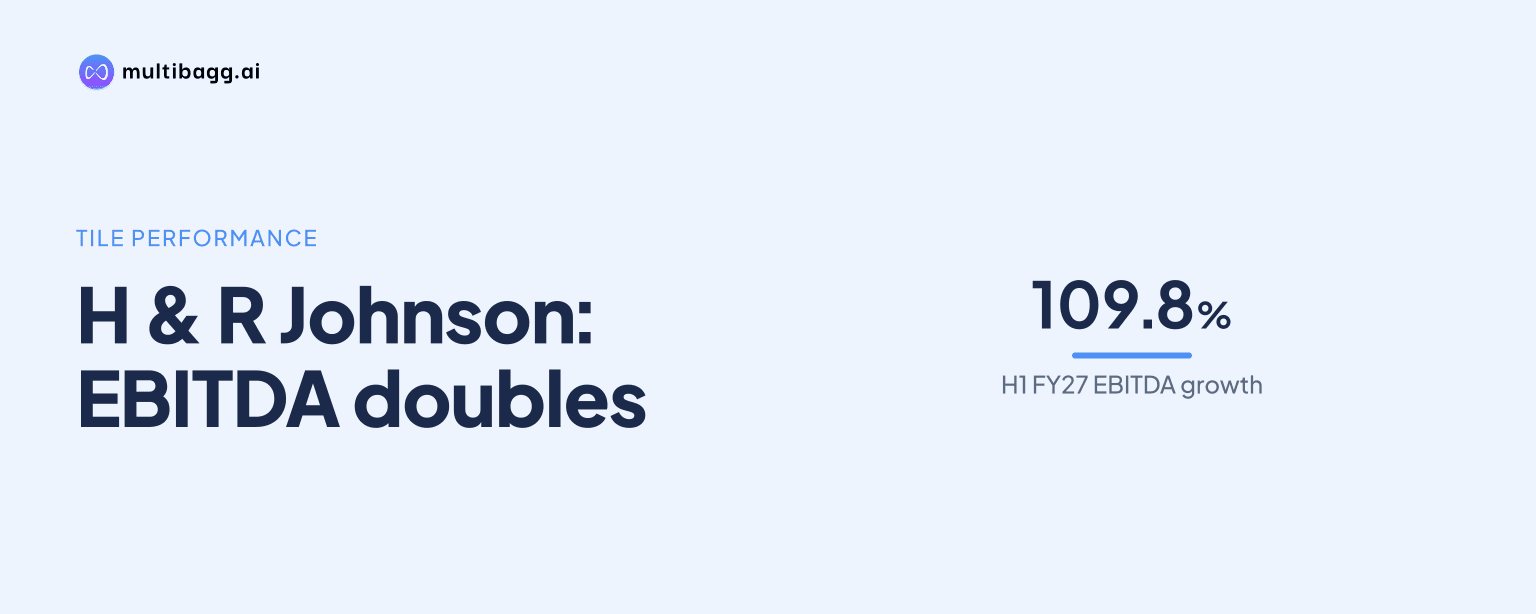
H & R Johnson more than doubled earnings before interest, tax, depreciation and amortisation (EBITDA) in the first half of financial year 2027 (H1 FY27), with EBITDA rising 109.8% to Rs 126.4 crore despite an 8.8% decline in tile volume. Tile realisations rose 17.1% to Rs 395 per square metre, helping EBITDA margin reach 10.4% from 5.3% a year earlier.
Know Prism Johnson inside out
Results, valuation, peers and who's buying, in one view.
How did HRJ’s H1 FY27 profitability change?
HRJ reported revenue of Rs 1,212 crore in H1 FY27, up 6.9% year on year, while EBITDA increased to Rs 126.4 crore from Rs 60.2 crore. The increase in EBITDA was substantially faster than revenue growth, lifting the reported EBITDA margin by 5.1 percentage points to 10.4%.
HRJ’s Tiles Division generated Rs 988 crore of H1 FY27 revenue, a 6.8% increase from a year earlier. Johnson Bath Division (JBD) revenue rose 9.6% to Rs 166 crore, while Industrial Products and Natural Resources Division (IPNR) revenue increased 10.8% to Rs 54 crore. Tiles remained the largest business, representing 82% of H1 revenue, compared with 14% for JBD and 4% for other businesses.
The half-year result reflected an improvement through the first two quarters. EBITDA was Rs 47 crore at a 9.0% margin in Q1 FY27 and rose to Rs 79 crore at an 11.5% margin in Q2 FY27. In Q2 FY26, EBITDA was Rs 42 crore at a 7.2% margin, while Q2 FY27 revenue increased 17.6% to Rs 690 crore.
Why did HRJ’s earnings rise while tile volume fell?
HRJ’s H1 FY27 earnings recovery was driven by pricing and product mix rather than tile-volume growth. Tile realisations increased 17.1% year on year to Rs 395 per square metre, reflecting price increases implemented to pass on higher energy costs and an improved product mix. Tile sales volume, in contrast, declined to 25.0 million square metres from 27.4 million square metres.
The reduction was concentrated in the disruption-hit first quarter. Q1 FY27 tile volume was 10.8 million square metres, compared with 13.1 million square metres in Q1 FY26, whereas Q2 volume recovered to 14.3 million square metres, equal to Q2 FY26. HRJ said Q2 volume rose 32.5% quarter on quarter as operations rebounded from Middle East crisis-related disruptions.
Domestic tile volume in H1 FY27 was 24.6 million square metres, down from 26.6 million square metres a year earlier, while export volume was 0.4 million square metres versus 0.9 million square metres. The presentation attributes the H1 decline primarily to disruptions arising from the Middle East crisis in Q1 FY27, while stating that tile operations later stabilised with adequate gas availability across manufacturing locations.
Got a follow-up? Ask IRIS
Can HRJ sustain the higher EBITDA margin?
HRJ said it expects to sustain underlying EBITDA margins above 9%, after reporting a 10.4% H1 FY27 margin and an 11.5% Q2 FY27 margin. Management attributed the H1 expansion to higher realisations, disciplined cost management and a favourable net inventory impact. It also identified temporary cost-reduction measures among the factors supporting the Q2 FY27 profitability improvement.
Capacity utilisation is an operating measure to monitor. HRJ reported utilisation of 66.5% in H1 FY27 and 74.7% in Q2 FY27 across tile operations with total capacity of about 64 million square metres, including joint ventures. The business has 11 tile manufacturing plants, and management says it is evaluating further opportunities to improve manufacturing efficiency and product capabilities after recent modernisation and rationalisation work.
Return on capital employed (ROCE) was 14.9% in H1 FY27, compared with negative 1.4% in H1 FY26. Separately, HRJ reported Q2 FY27 ROCE of 22.0%, against 4.7% for FY26, with capital employed at Rs 988 crore as of September 30, 2026. The presentation says HRJ continues to monitor Middle East developments for possible effects on energy costs and gas availability.
How is HRJ changing its product mix and route to market?
HRJ is increasing the share of GVT, the presentation’s tile product-mix category, to support realisations. GVT represented 47% of tile sales volume in H1 FY27, up from 42% in FY26, 38% in FY25, 34% in FY24 and 28% in FY23. The company says the historical series was restated from Q2 FY27 to include eligible products across Endura, Johnson, Marbonite and Porselano tile segments.
In Q2 FY27, GVT accounted for 44% of HRJ’s tile mix, compared with the presentation’s industry reference range of about 70% to 80%. HRJ links further GVT scale-up to its brand, distribution and product-mix strategy. It has around 900 dealers, 22 large-format experience centres, and a multimedia advertising campaign launched in May 2025 in regional languages across several media platforms, including television.
JBD is another part of the expansion plan, having delivered Rs 90 crore of revenue in Q2 FY27, up 17.5% year on year. HRJ plans more than 100 new stock-keeping units across faucets, showers, water closets and basins, and is targeting more than 450 JBD dealers by the end of FY27, compared with a base of more than 400 dealers in FY26. The plan also includes project and institutional business, plant-utilisation improvement, sourcing rationalisation and inventory discipline.
Conclusion
HRJ’s H1 FY27 performance shows that a 17.1% increase in tile realisations and cost measures outweighed an 8.8% decline in tile volume. Revenue rose 6.9% to Rs 1,212 crore, but EBITDA grew 109.8% to Rs 126.4 crore and margin reached 10.4%, making the recovery primarily a realisation and margin outcome rather than a volume-led expansion.
The next indicators are whether HRJ can maintain underlying EBITDA margins above 9%, improve utilisation from the 66.5% reported for H1 FY27, and continue increasing the 47% GVT share. Management’s FY27-end JBD targets of more than 450 dealers and over 100 new stock-keeping units, alongside unresolved Middle East energy-cost and gas-availability risks, will shape subsequent performance.