










Prism Cement Q2 FY27 EBITDA per tonne falls 25% despite premium mix
Key highlights
- Prism Cement's premium-product share rose to 69% in Q2 FY27 from 49% in Q2 FY26.
- Prism Cement's Q2 FY27 EBITDA per tonne fell 25.0% year on year to ₹526.
- Prism Cement's Q2 FY27 realisation was ₹4,660 per tonne while operating cost was ₹4,134 per tonne.
- Prism Cement's average lead distance declined to 352 km in H1 FY27 from 367 km in H1 FY26.
powered by IRIS
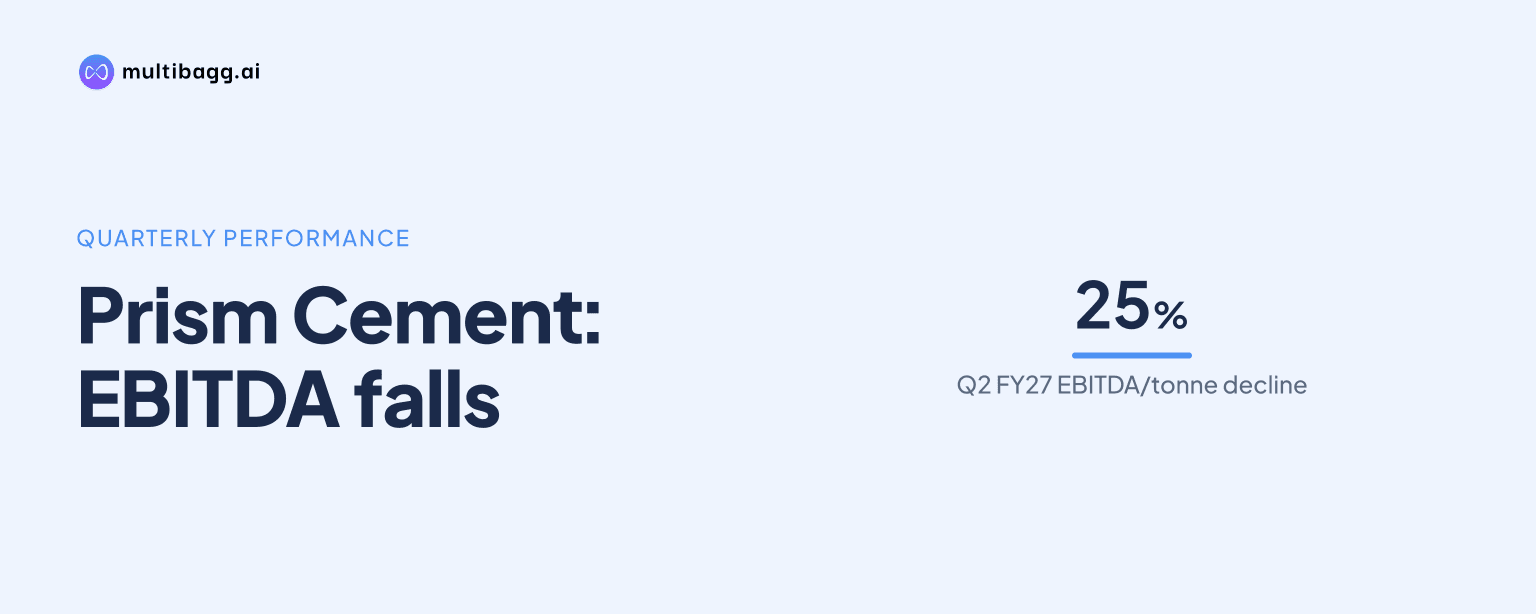
Prism Cement raised premium products to 69% of cement sales volume in Q2 FY27 from 49% a year earlier, but EBITDA per tonne fell 25% to ₹526 from ₹701 as higher fuel and raw-material costs coincided with limited pricing pass-through. Revenue increased 1.6% to ₹774 crore and volume grew 2.4% to 1.66 million tonnes.
Know Prism Johnson inside out
Results, valuation, peers and who's buying, in one view.
What drove Prism Cement's Q2 FY27 EBITDA per tonne decline?
Prism Cement's EBITDA, or earnings before interest, tax, depreciation and amortisation, per tonne declined because operating costs rose while realisations declined. Q2 FY27 EBITDA was ₹87 crore, down from ₹114 crore in Q2 FY26, and the EBITDA margin fell to 11.3% from 14.9%. Revenue nevertheless increased to ₹774 crore from ₹762 crore over the same period.
The cost and realisation movements explain the per-tonne margin reduction. Total operating cost increased 3.5% year on year to ₹4,134 per tonne in Q2 FY27, while realisation fell 0.8% to ₹4,660 per tonne. Power and fuel cost rose 9.0% to ₹1,389 per tonne, and raw-material cost increased 13.5% to ₹614 per tonne.
Fuel cost was ₹1.67 per Mcal, or million calories, in Q2 FY27, compared with ₹1.49 per Mcal in Q2 FY26. Prism Cement said its flexible use of petcoke, domestic coal and alternative fuels according to relative costs cushioned the impact of higher fuel prices. The presentation nevertheless cited industry-wide input-cost pressure and limited pass-through under prevailing pricing conditions.
Did Prism Cement's premium-product strategy change its sales mix?
Prism Cement's premium-product share increased by 20 percentage points year on year to 69% of total cement sales volume in Q2 FY27. The premium portfolio comprises Champion Plus, Champion Duratech and Champion All Weather. The Q2 FY27 share also rose from 67% in Q1 FY27, while Q2 FY26 had recorded a 49% share.
The premium mix has increased over a longer period. Premium products represented 54% of total sales volume in FY26, up from 42% in FY25, while H1 FY27 reached 68% against 47% in H1 FY26. Q2 FY27 realisation of ₹4,660 per tonne was still lower than ₹4,696 per tonne a year earlier, showing that the disclosed product-mix change did not remove the quarter's pricing and input-cost pressures.
Prism Cement's Q2 FY27 regional sales were concentrated in Uttar Pradesh, which accounted for 61%, followed by Bihar at 22%, Madhya Pradesh at 16% and other markets at 1%. Trade-channel sales accounted for 78% of the mix, compared with 74% in Q2 FY26. The company had around 2,300 effective dealers as of March 31, 2026.
Got a follow-up? Ask IRIS
How did Prism Cement's Q2 and H1 FY27 performance compare?
Prism Cement recorded 2.4% year-on-year volume growth in Q2 FY27, while H1 FY27 sales volume declined 2.2% from the prior-year half. Quarterly volume was 1.66 million tonnes, compared with 1.62 million tonnes in Q2 FY26. Management said higher-than-usual rainfall in key micro-markets during the latter half of Q2 moderated growth momentum despite intact underlying demand in Central India.
H1 FY27 volume, including cement and clinker, was 35.1 million tonnes compared with 35.9 million tonnes in H1 FY26. Revenue was broadly unchanged at ₹1,676 crore against ₹1,675 crore, but EBITDA fell 13.8% to ₹218 crore from ₹253 crore. The H1 EBITDA margin declined to 13.0% from 15.1%.
H1 FY27 EBITDA per tonne was ₹621, down 11.9% from ₹705 in H1 FY26, while fuel cost increased to ₹1.63 per Mcal from ₹1.59 per Mcal. Return on capital employed, or ROCE, was 19.1% in H1 FY27 compared with 21.8% in H1 FY26. The presentation attributes the H1 per-tonne decline to input-cost pressure and limited pricing pass-through.
Can logistics and renewable power lower Prism Cement's costs?
Prism Cement has reduced transport lead distance, although its Q2 total operating cost still increased by ₹139 per tonne year on year. Average lead distance fell to 362 km in Q2 FY27 from 381 km in Q2 FY26. It was 352 km in H1 FY27, compared with 367 km in H1 FY26.
Freight and forwarding cost was ₹1,049 per tonne in Q2 FY27, up 1.4% from ₹1,035 per tonne a year earlier. In H1 FY27, freight and forwarding cost was ₹1,107 per tonne, 5.0% above H1 FY26. The distance reduction therefore coincided with a modest quarterly freight-cost increase but did not offset power, fuel and raw-material movements.
Prism Cement had 55 megawatts of green-power capacity at Satna in FY26, comprising 22.5 megawatts of waste heat recovery system capacity and 32.5 megawatts of solar capacity. Solar and waste heat recovery represented 34.6% of the H1 FY27 power mix, compared with 32.7% in FY26. The company has signed a 49.5-megawatt wind-power agreement that is expected to be fully operational by Q2 FY29.
Alternative-fuel usage increased to 9.0% in Q2 FY27 from 1.9% in Q2 FY26. For H1 FY27, domestic coal accounted for 72.9% of the fuel mix, petcoke for 19.0% and alternative fuels for 8.0%. Power consumption was 70.6 kilowatt-hours per tonne in H1 FY27, compared with 69.1 kilowatt-hours per tonne in FY26.
Conclusion
Prism Cement's Q2 FY27 performance separates progress in product mix and logistics from reported earnings. Premium-product share rose to 69%, trade mix increased to 78%, and Q2 lead distance declined by 19 km year on year. However, realisation fell to ₹4,660 per tonne as total operating cost reached ₹4,134 per tonne, reducing EBITDA per tonne by 25% to ₹526.
Management expects post-monsoon normalisation of construction activity to support deferred demand and volume growth in H2 FY27, while noting that quarterly maintenance shutdowns make full-year assessment more relevant for the Cement Division. The disclosed items to watch are any improvement in industry pricing conditions, progress on margin measures including fuel and logistics optimisation, and execution of the 49.5-megawatt wind agreement scheduled to become fully operational by Q2 FY29.