










Happiest Minds fixed-price share reaches 31.7% in Q2 FY27
Key highlights
- Happiest Minds reported fixed-price revenue of 31.7% in Q2 FY27, compared with 26.1% in FY24.
- Happiest Minds’ revenue-by-geo data sheet listed USA revenue at 56.3% in Q2 FY27, down from 70.7% in FY24.
- APAC represented 9.0% of Q2 FY27 revenue, while ROW represented 8.8%.
- Happiest Minds had 311 active customers and 52 million-dollar customers in Q2 FY27.
powered by IRIS
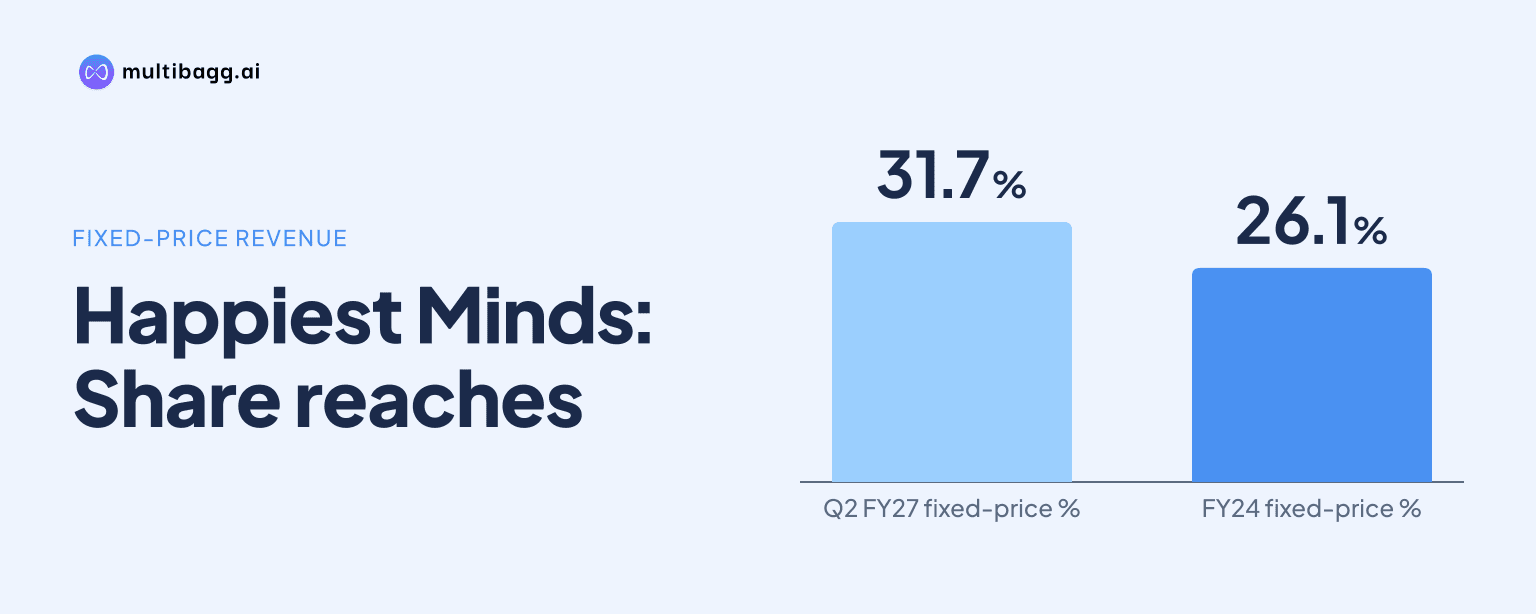
Happiest Minds reported fixed-price contracts at 31.7% of Q2 FY27 revenue, up from 26.1% in FY24, while its data sheet put USA revenue at 56.3%, down from 70.7%. The presentation also shows APAC at 9.0% and rest of world at 8.8%, documenting a changed contract and geographic revenue mix.
Know Happiest Minds Technologies inside out
Results, valuation, peers and who's buying, in one view.
How did Happiest Minds’ contract mix change in Q2 FY27?
Happiest Minds increased fixed-price revenue to 31.7% in Q2 FY27, while time-and-material, or T&M, contracts accounted for 68.3%. Fixed-price revenue rose by 0.9 percentage points from 30.8% in Q1 FY27 and by 5.2 percentage points from 26.5% in FY26. T&M moved in the opposite direction, declining from 69.2% in Q1 FY27 and 73.5% in FY26.
The multiyear record shows that the change followed a dip in FY25. Fixed-price revenue was 26.1% in FY24, fell to 24.1% in FY25 and then reached 26.5% in FY26 before rising above 30% in both reported FY27 quarters. T&M was 73.9% in FY24 and 75.9% in FY25, compared with 68.3% in Q2 FY27.
The quarterly progression was also upward across the last four reported quarters. Fixed-price work was 24.8% in Q2 FY26, 28.5% in Q3 FY26 and 29.8% in Q4 FY26, before reaching 30.8% in Q1 FY27. The presentation does not attribute the movement to customer wins, project scope, renewals or delivery decisions.
How much did Happiest Minds’ USA revenue share decline?
Happiest Minds’ revenue-by-geo data sheet listed USA revenue at 56.3% in Q2 FY27, down 14.4 percentage points from 70.7% in FY24 and 8.3 percentage points from 64.6% in FY25. The figure also declined sequentially from 56.9% in Q1 FY27 and was below the FY26 level of 59.3%.
The presentation’s current-period geography summary labels a 56.3% category as Americas, whereas its time-series data sheet labels the 56.3% category as USA. The two pages therefore report the same Q2 FY27 percentage under different geographic labels. The source does not explain the difference in labelling, so the USA time series and the Americas summary should be read as separately presented disclosures.
India represented 18.0% of Q2 FY27 revenue, compared with 16.3% in FY24, although it eased from 18.3% in Q1 FY27. Asia-Pacific, or APAC, reached 9.0%, up from 5.3% in FY25, while rest of world, or ROW, rose from 4.1% in FY24 to 8.8%. Europe was 7.8%, compared with 8.9% in FY24 and 7.9% in Q1 FY27.
Got a follow-up? Ask IRIS
Which services and industries accounted for Happiest Minds’ revenue?
Happiest Minds’ largest disclosed technology offering was digital infrastructure and cloud at 50.7% of Q2 FY27 revenue. Software as a service, or SaaS, accounted for 20.6%, artificial intelligence, or AI, and analytics contributed 13.3%, security solutions represented 5.8%, and Internet of Things, or IoT, represented 0.7%. Other offerings made up 8.9%.
Digital infrastructure and cloud fell from 53.1% in Q1 FY27 and 53.2% in FY26 to 50.7% in Q2 FY27. AI and analytics increased from 11.6% in Q1 FY27 and 11.1% in FY26 to 13.3%, matching its FY24 proportion. SaaS declined from 21.4% in Q1 FY27 and 25.7% in FY24 to 20.6%.
Banking, financial services and insurance, or BFSI, was the largest industry vertical at 27.7% in Q2 FY27, followed by healthcare at 17.8% and education technology at 15.4%. BFSI rose from 10.9% in FY24 and 26.8% in Q1 FY27. Education technology declined from 23.9% in FY24, while healthcare was below its Q1 FY27 share of 18.4% but above 14.4% in FY24.
What customer and delivery measures add context to the shift?
Happiest Minds had 311 active customers in Q2 FY27, compared with 306 in Q1 FY27 and 250 in FY24. The number of million-dollar customers was unchanged at 52 from Q1 FY27, versus 57 in FY25. Within that group, four customers generated more than US$10 million and eight generated between US$5 million and US$10 million.
Customer concentration was 28.7% for the top five customers, 42.4% for the top 10 and 58.7% for the top 20. Separately, customers with relationships of five years or less generated 58% of FY26 revenue, increasing from 52% in FY24. Customers with relationships longer than five years contributed 42% in FY26, compared with 48% in FY24.
Offshore delivery represented 86.8% of Q2 FY27 revenue, compared with 85.4% in Q1 FY27 and 87.6% in FY26; onsite revenue was 13.2%. Employee deployment was more heavily offshore, with 92.9% of employees offshore and 7.1% onsite in Q2 FY27. Utilization was 81.8%, up from 80.9% in Q1 FY27.
Conclusion
Happiest Minds’ Q2 FY27 presentation records a higher fixed-price share and a lower USA share in its revenue-by-geo data sheet. Fixed-price work reached 31.7%, versus 26.1% in FY24, while the USA figure was 56.3%, versus 70.7%. APAC and ROW together accounted for 17.8% in Q2 FY27, compared with 10.5% in FY25.
The presentation provides no fixed-price target, geographic target or stated cause for these movements. Subsequent disclosures will show whether fixed-price work remains above 30%, whether the USA data-sheet share continues to fall, and whether the 311 active-customer count and 52 million-dollar-customer count change.