










Happiest Minds Q2 revenue rises 12.5% as PAT falls 8% sequentially
Key highlights
- Happiest Minds’ Q2 FY27 revenue was Rs 645.43 crore, up 12.5% year on year.
- Happiest Minds’ reported Q2 FY27 PAT was Rs 62.19 crore, down 8.0% from Q1 FY27.
- Happiest Minds’ Q2 FY27 operating margin increased to 18.5% from 17.5% in Q1 FY27.
- Happiest Minds recorded a Rs 3.98 crore exceptional item for its proposed merger with ITC Infotech.
powered by IRIS
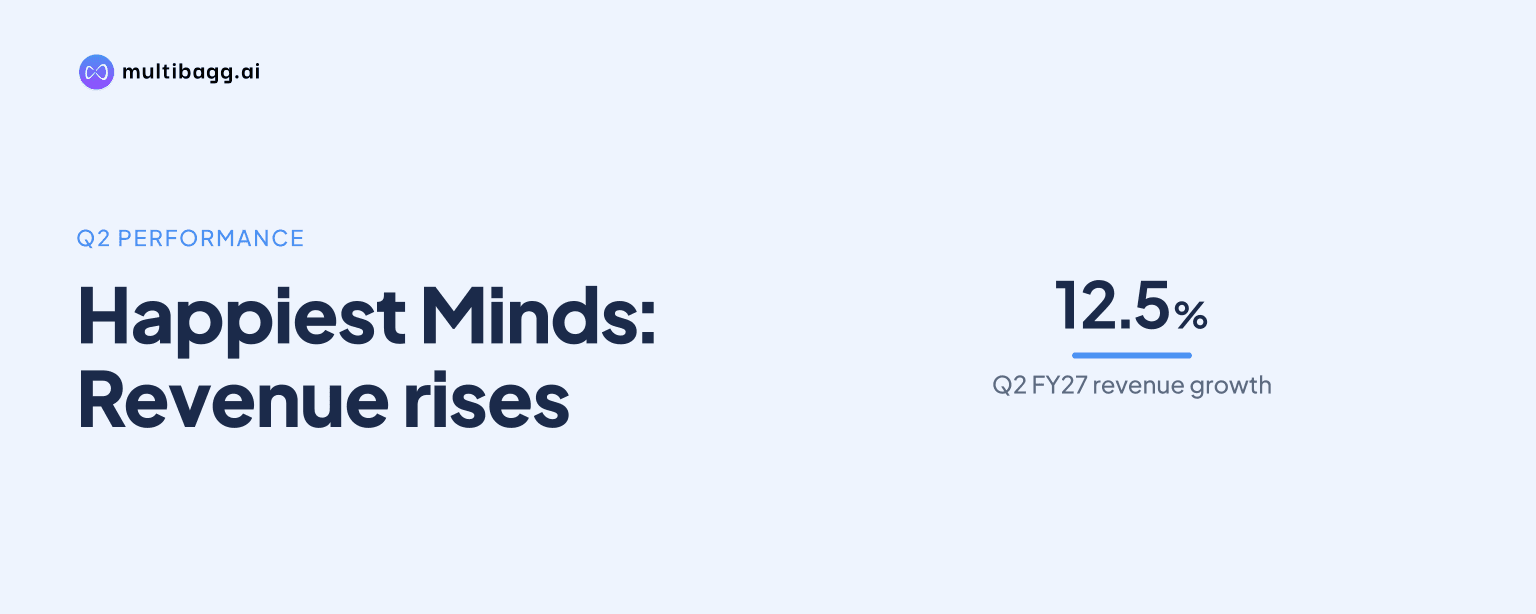
Happiest Minds reported Q2 FY27 revenue of Rs 645.43 crore, 12.5% higher year on year, but reported profit after tax fell 8.0% sequentially to Rs 62.19 crore as finance cost, depreciation and a Rs 3.98 crore merger-related exceptional item reduced profit before tax.
Know Happiest Minds Technologies inside out
Results, valuation, peers and who's buying, in one view.
How did Happiest Minds perform in Q2 FY27?
Happiest Minds increased revenue to Rs 645.43 crore in Q2 FY27 from Rs 628.51 crore in Q1 FY27, a 2.7% quarter-on-quarter rise, and from Rs 573.57 crore in Q2 FY26, a 12.5% year-on-year increase. Total income rose 2.1% sequentially to Rs 665.99 crore, including Rs 20.56 crore of other income, compared with Rs 652.20 crore in Q1 FY27.
For the first half of FY27, Happiest Minds reported revenue of Rs 1,273.94 crore, up 13.4% from Rs 1,123.47 crore in HY26. Total income for HY27 was Rs 1,318.18 crore, a 12.2% increase from Rs 1,175.11 crore in HY26. The half-year comparison shows revenue growth across both reported FY27 quarters.
Why did Happiest Minds’ reported profit fall sequentially?
Happiest Minds’ reported profit after tax, or PAT, was Rs 62.19 crore in Q2 FY27, down from Rs 67.60 crore in Q1 FY27 despite higher revenue. Profit before tax, or PBT, declined 7.4% sequentially to Rs 83.53 crore from Rs 90.20 crore, while the PBT margin moved to 12.5% from 13.8%.
The quarter included finance cost of Rs 30.86 crore, up from Rs 28.46 crore in Q1 FY27, and depreciation of Rs 13.12 crore, up from Rs 12.08 crore. Happiest Minds also recorded a Rs 3.98 crore exceptional item towards its proposed merger with ITC Infotech. Amortization and unwinding interest remained Rs 10.55 crore in both quarters; Happiest Minds describes these as non-cash items related to acquisitions.
Adjusted PBT, which adds back exceptional items and amortization of intangible assets, was Rs 98.06 crore in Q2 FY27, 2.7% below Rs 100.75 crore in Q1 FY27. Adjusted PAT was Rs 79.11 crore, down 1.8% sequentially from Rs 80.52 crore but 20.7% above Rs 65.52 crore in Q2 FY26. This comparison separates the reported PAT decline from Happiest Minds’ stated adjusted measure.
Did Happiest Minds’ operating margin improve in Q2 FY27?
Happiest Minds’ operating margin improved to 18.5% in Q2 FY27 from 17.5% in Q1 FY27 and 17.0% in Q2 FY26. In value terms, operating margin increased 9.6% sequentially to Rs 119.11 crore and rose 22.4% year on year from Rs 97.33 crore.
Earnings before interest, tax, depreciation and amortization, or EBITDA, reached Rs 142.04 crore, marginally above Rs 141.29 crore in Q1 FY27 and 18.1% higher than Rs 120.27 crore a year earlier. However, the EBITDA margin was 21.3%, compared with 21.7% in Q1 FY27, even as it exceeded the 20.2% recorded in Q2 FY26. Operating-margin percentage therefore rose sequentially while EBITDA margin was 0.4 percentage points lower.
The Q2 FY27 operating-margin percentage was also above the 17.4% reported for FY26 and the 17.5% reported for FY25. EBITDA margin of 21.3% was above FY26’s 20.3% but below FY25’s 21.4%. Adjusted earnings per share were Rs 5.25 in Q2 FY27, compared with Rs 5.34 in Q1 FY27 and Rs 4.46 in Q2 FY26.
Got a follow-up? Ask IRIS
Which business areas accounted for Happiest Minds’ revenue mix?
Happiest Minds derived 76.7% of Q2 FY27 revenue from Product & Digital Engineering Services, or PDES, making it the largest business unit. Infrastructure Management and Security Services, or IMSS, represented 17.9%, while Generative AI Business Solutions, or GBS, accounted for 5.4%.
By technology category, Digital Infrastructure and Cloud contributed 50.7% of revenue, followed by software as a service at 20.6% and artificial intelligence and analytics at 13.3%. Security represented 5.8%, Internet of Things 0.7%, and other technologies 8.9%. Digital Infrastructure and Cloud therefore accounted for just over half of Q2 FY27 revenue.
The Americas accounted for 56.3% of revenue, while India contributed 18.0%, Asia-Pacific 9.0%, rest of world 8.8%, and Europe 7.8%. Banking, financial services and insurance was the largest vertical at 27.7%, followed by healthcare at 17.8% and education technology at 15.4%. Time-and-material contracts supplied 68.3% of revenue, compared with 31.7% from fixed-price contracts.
What do Happiest Minds’ workforce and customer measures show?
Happiest Minds reported utilization of 81.8% and headcount of 6,466 in Q2 FY27. Utilization increased from 80.9% in Q1 FY27, while headcount fell by 66 from 6,532. The workforce mix was 92.9% offshore and 7.1% onsite, compared with 93.1% offshore and 6.9% onsite in the preceding quarter.
Trailing-12-month voluntary attrition declined to 14.3% in Q2 FY27 from 15.4% in Q1 FY27 and 17.4% in Q2 FY26. Happiest Minds had 311 active customers, up from 306 in Q1 FY27, while the number of million-dollar customers remained unchanged at 52 for the second consecutive quarter.
Revenue concentration data show the top five customers represented 28.7% of revenue, the top 10 represented 42.4%, and the top 20 represented 58.7%. Happiest Minds’ Agile delivery model accounted for 93.1% of Q2 FY27 revenue, compared with 93.7% in Q1 FY27 and 94.2% in Q2 FY26.
Conclusion
Happiest Minds combined 12.5% year-on-year Q2 FY27 revenue growth with a 1.0 percentage-point sequential increase in operating margin to 18.5%. However, reported PAT declined 8.0% from Q1 FY27 as PBT absorbed higher finance cost and depreciation as well as the Rs 3.98 crore exceptional expense related to the proposed ITC Infotech merger.
The proposed merger remains the key disclosed unresolved matter, following the Q2 FY27 exceptional item. Subsequent results can show whether revenue growth, the 18.5% operating margin, 311 active customers and 81.8% utilization are sustained as the merger process progresses.